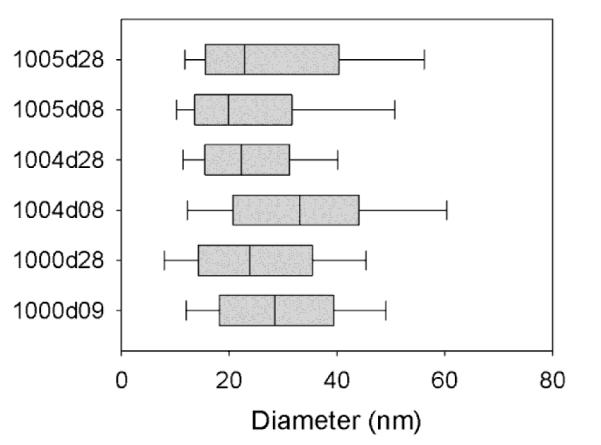
Figure 2.

The size distribution of lactosomes derived from early and mature milks from various donors. Each box plot represents the distribution of repeated particle diameter measurement using a commercial dynamic light scattering device. The first four digits denote the sample donor (1000, 1004, 1005) while the final two indicate the postpartum day after labor (08, 09 or 28).
