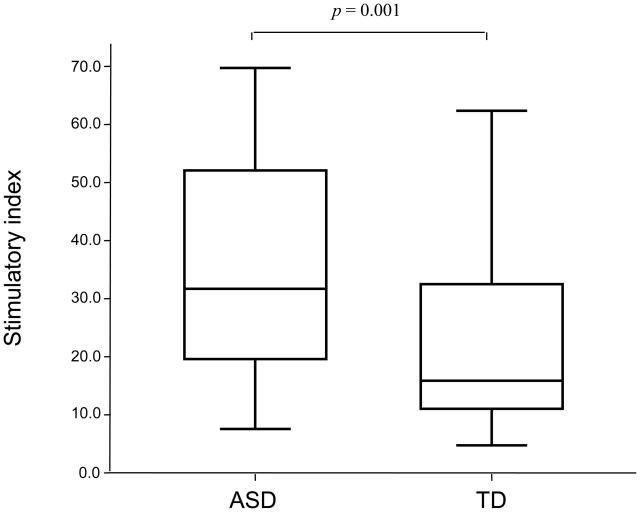
Figure 1.
Comparison of cellular responses following PHA stimulation in children with autism spectrum disorders (ASD; n = 37) and age-matched typically developing age-matched controls (TD; n =35). Data are expressed as a stimulation index (S.I.). Horizontal box lines are 25%, 50% (median) and 75% of the distribution with whiskers marking 1.5 times the interquartile range.

