
Figure 2. Overexpressed IL-8 is involved in cell migration and invasion in colon cancer cells.
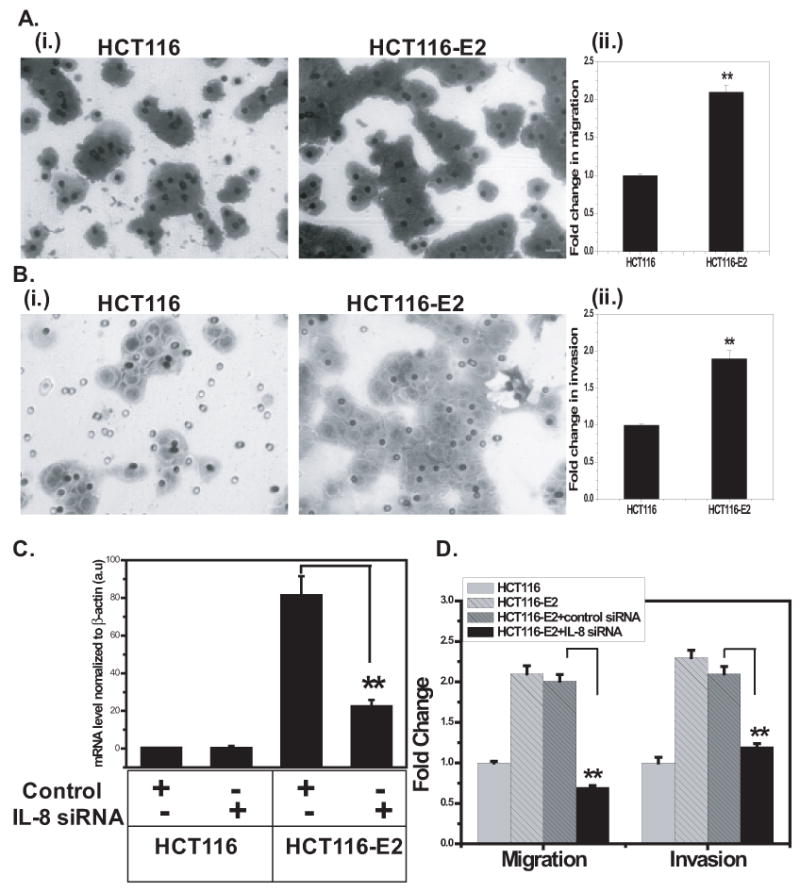
A, Migration assay. (i.) HCT116 and HCT116-E2 cells (2×10⁵ cells/well) in a 24-well Boyden chambers with feeder tray were incubated with media for 48 h. Cell migration was determined by staining with crystal violet as mentioned above. Cells were photographed. Dark staining were migratory cells (original magnification, ×200). (ii.) Migration assay was quantitated. Columns shows fold change over the number of HCT116 control cells that migrated (**, P<0.005). B, Invasion assay. (i.) HCT116 and HCT116-E2 cells (2×10⁵ cells/well) were plated on porous cell culture inserts which coated with Matrigel and allowed to invade for 48 h. Dark staining were invasive cells (original magnification, ×200). (ii.) Invasion assay was quantitated. Columns shows fold change over the number of HCT116 control cells that invaded (**, P<0.005). C, Q-PCR analysis of IL-8 expression knockdown in HCT116 and HCT116-E2 cells. All siRNA experiments were done with the following cells: untransfected cells, mock-transfected cells (control siRNA), siRNA-transfected cells (siRNA #2261). D, Quantitation of migration and invasion after siRNA transfection. HCT116, HCT116-E2, control-transfected HCT116-E2, and siRNA transfected HCT116-E2 cells were incubated on Boyden chambers or Matrigel for 48 h as described in Materials and Methods. Columns shows fold change over the number of HCT116 control cells that migrated or invaded. The results are representative of a minimum of three independent experiments. Data shown represent the mean ± standard deviation (**, P<0.005).