
Figure 5. Memory CD8 T cell response in Cl 13 infected dnTGFBRII mice.
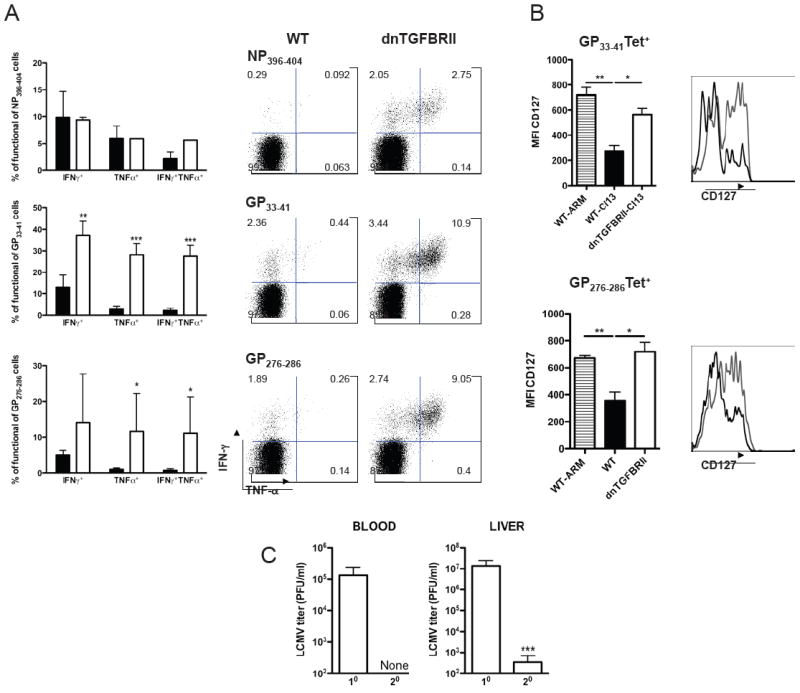
WT (black bars or histograms) or dnTGFBRII (white bars or grey histograms) mice were infected with LCMV Cl 13. A) Splenocytes were obtained at day 49 pi, stimulated with NP396-404, GP33-41 and/or GP276-286 LCMV peptides and production of IFN-γ and TNF-α by CD8 T cells was analyzed. Bar graphs depict average % ± sd of cytokine-producing CD8+ T cells normalized to the number of corresponding tetramer+ cells in the same spleen. Dot plots display one representative mouse per group; Numbers indicate the % of cells within the respective gate. B) CD127 expression was quantified in Db/GP33-41+CD8+ and Db/GP276-286+CD8+ blood cells after 2 months pi. Bar graphs indicate the average CD127 MFI ± sd. ARM infected mice were processed as controls (striped bars). Histograms depict one representative mouse per group. C) dnTGFBRII mice were re-challenged with LCMV Cl 13 (secondary, 20) and processed in parallel to primary-infected dnTGFBRII mice (10). Average viral titers in blood and liver at day 5 pi ± sd are depicted. Results are representative of two experiments with three to five mice per group. (WT vs dnTGFBRII or 10 vs 20, *p<0.05, **p<0.005 and ***p<0.0005)