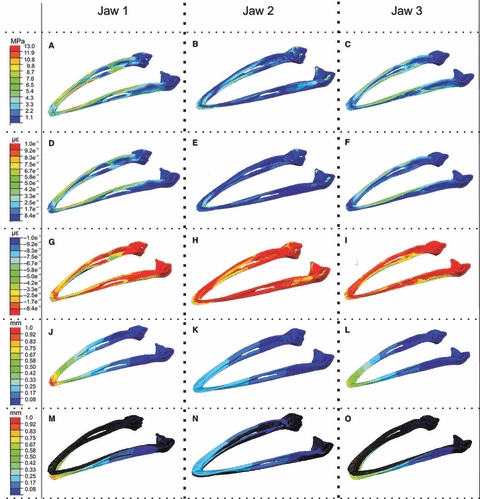
Fig. 4.

Stress, strain and deformation plots for the finite element results. Left column: jaw 1 results; middle column: jaw 2 results; right column: jaw 3 results. (A–C) Von Mises stress, all plots scaled to 13 MPa peak stress. (D–F) Maximum principal strain, all plots scaled to 0.001 peak strain. (G–I) Minimum principal strain, all plots scaled to −0.001 peak strain. (J–L) Displacement, all plots scaled to 1 mm peak displacement. (M–O) Displacement ×10 with original undeformed model plotted in dark blue, all plots scaled to 1 mm peak displacement as before. All plots (A–L) are the deformed contour plots, scaled to a deformation of ×1.
