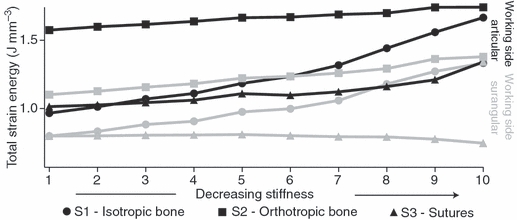
Fig. 4.

Plot showing changes in stored elastic energy (values reported × 10−3), plotted on the ‘y’ axis, with decreases in stiffness in the 10 trials in each set, plotted along the ‘x’ axis. Set 1, isotropic bone with no sutures, is represented by circles; set 2, orthotropic bone with no sutures, is represented with squares; and set 3, isotropic bone with sutures, is represented by triangles. The stiffest trial is to the left and the least stiff is to the right. Results for two bones are plotted here, the working side articular in black and the working side surangular in gray. In the working side articular, stored elastic energy in all sets increases as stiffness decreases. Stored elastic energy is smaller in the isotropic condition (circles) than it is in the orthotropic condition (squares); however, the rate at which stored elastic energy increases is smaller in the orthotropic condition such that as it approaches isotropy the two values converge. Stored elastic energy in set 3 (triangles) is smaller in all trials compared with the isotropic (circles) and orthotropic (squares) conditions. This trend and relationship among the sets is representative of all bones in the mandible, with the exception of the working and balancing side surangulars (summarized in Table 1). For the working side surangular plotted here, stored elastic energy in sets one and two increases as stiffness decreases. For set 3, stored elastic energy decreases as suture stiffness decreases.
