
Fig. 5.
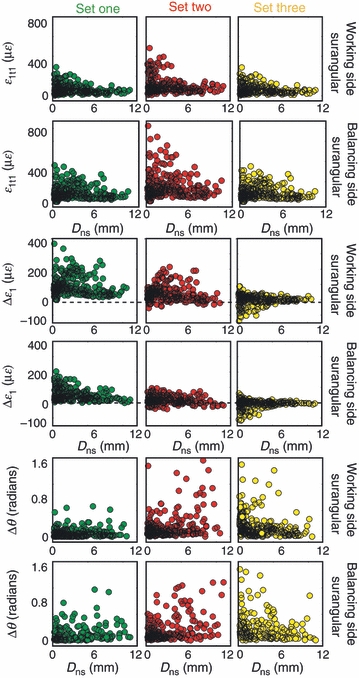
Scatter plot showing the relationship between the distance of each brick to a suture (Dns) with magnitude of maximum principal strain in the stiffest trial in each set (ε1t1), the difference in the magnitude of maximum principal strain between the stiffest and least stiff conditions in each set (Δε1), and the difference in the orientation of maximum principal strain between the stiffest and least stiff conditions in each set (Δθ). Set 1 is represented by green, set 2 is represented by red, and set 3 is represented by yellow. This plot shows that the largest values of ε1t1 are found at small values of Dns in all sets. The largest values of Δε1 are found at small values of Dns in set 1, on the balancing side in sets 2 and 3, and at high values of Dns in the balancing side of set 2. The largest values of Δθ are found at small values of Dns in sets 1 and 3, and high values of Dns in set 2.