
Fig. 12.
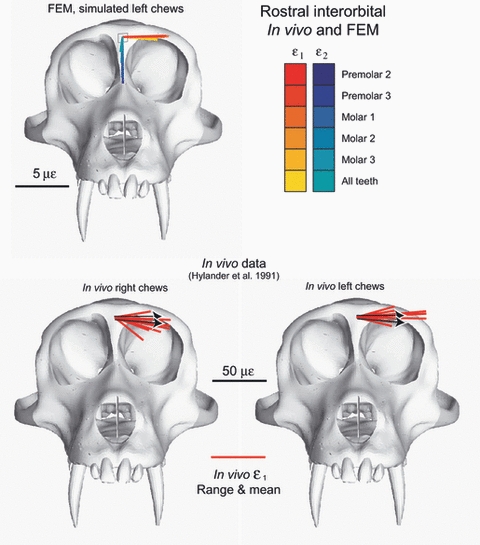
Strain vector plots of strain data collected from the rostral interorbital gage site in vivo and from the FEM. The top figure illustrates in silico data from the rostral interorbital ‘gage site’ on the model. Each line is a vector representing the mean orientation and magnitude of maximum (ε1) (red to yellow) and minimum (ε2) (blue to green) principal strains from all the elements at the gage site. Note that the variance among the vectors from the in silico gage sites is due to variation in bite point, and the variance among vectors from in vivo gage sites is due to variation in magnitude and location of bite force, joint reaction forces and muscle forces. The in vivo strain vectors for the data presented by Hylander et al. (1991) are shown in the bottom two figures. The red lines indicate the means and ranges of the data. The black arrows on the in vivo plots represent the extremes of the ranges of the mean ε1 orientations from the in silico‘gage’ sites.