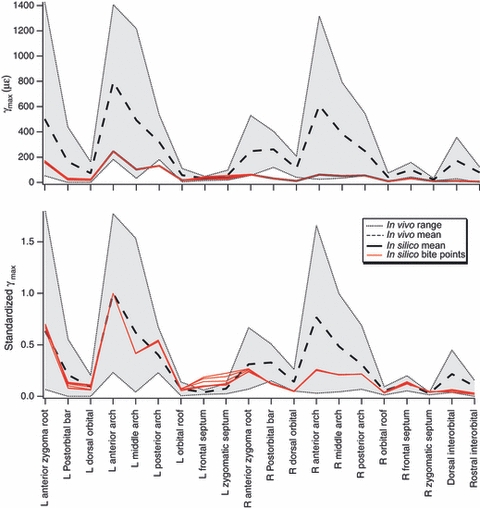
Fig. 15.

Plots comparing in vivo and FEM γmax values at 20 sites. L = left side = biting side, R = right = balancing side. Top figure presents absolute values of γmax; bottom figure shows γmax standardized by dividing the in vivo data by the average value recorded at the anterior zygomatic arch site and the in silico data by the largest value recorded at the same site. The in vivo mean is the average across all data recorded at that site; the in vivo range was estimated as the largest and smallest values across all experiments of the mean ± 2 SD. In vivo data are from apple chewing data collected in this study and published in the literature (Hylander et al., 1991; Hylander & Johnson, 1997a,b; Strait et al., 2005).
