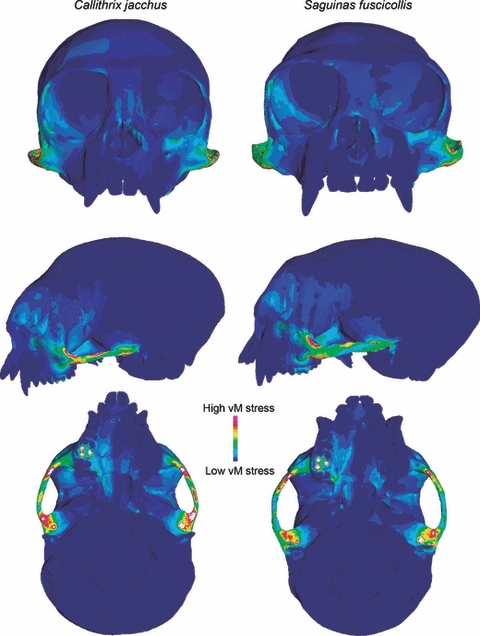
Fig. 4.

The predicted distribution of von Mises stress in models of Callithrix jacchus (left) and Saguinus fuscicollis (right) during unilateral molar biting (15° gape). Warm colors indicate high von Mises stress and cool colors indicate regions of low stress. White areas indicate stresses that exceed the range specified for the contour plot.
