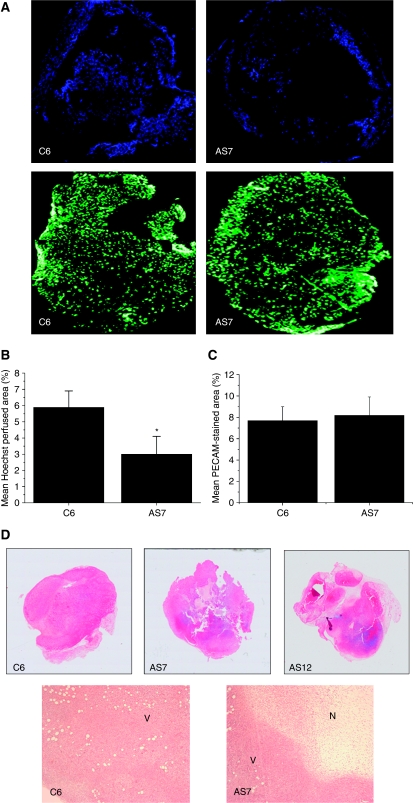
Figure 4.
Assessment of tumour perfusion by fluorescence microscopy. (A) Composite fluorescence images of Hoechst 33342 uptake, and PECAM staining, in whole C6 and AS7 tumour sections. Note that Hoechst 33342 uptake is restricted to the periphery of the AS7 tumour. (B) Quantitation of Hoechst 33342 uptake (mean Hoechst perfused area, %) obtained from three sections each of C6 (n=5) and AS7 (n=4) tumours. (C) Quantitation of vascular density (mean PECAM stained area, %) obtained from sections of C6 (n=6) and AS7 (n=4) tumours. Results are mean±1 s.e.m., *P<0.05, Student's t-test. (D) Composite images of whole haematoxylin and eosin-stained sections of tumours derived from C6, AS7 or AS12 cells, and localised images ( × 40 magnification) acquired from within the same sections. Parental C6 tumours exhibited homogeneous, viable (V) tissue, whereas the AS7 and AS12 tumours presented with increased central necrosis (N) and a reduction of viable tissue.

