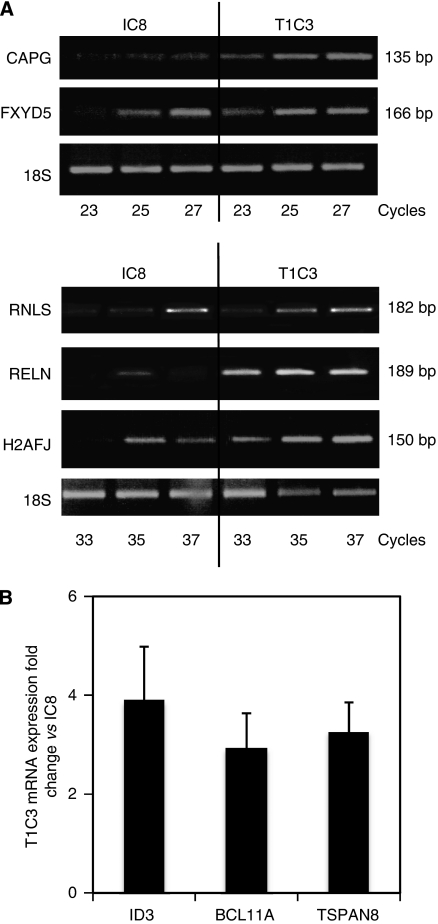
Figure 1.
Reverse transcription–polymerase chain reaction (RT–PCR) analysis of eight selected genes differentially expressed in invasive (T1C3) and non-invasive (IC8) clones, according to microarray analysis. (A) Semiquantitative PCR was performed with total RNA isolated from both clones. PCR products were loaded on a 1.2% agarose gel and stained with ethidium bromide. The expected length of PCR products is indicated on the right. The data are representative of three experiments. (B) Quantitative RT–PCR analysis of three genes in T1C3 cells compared with IC8 cells. Copy number was first normalised to 18SRNA levels and expressed as the fold-change over IC8 cells. The graph depicts the mean of these fold-changes ±s.d. of three independent amplifications.

