Figure 1.
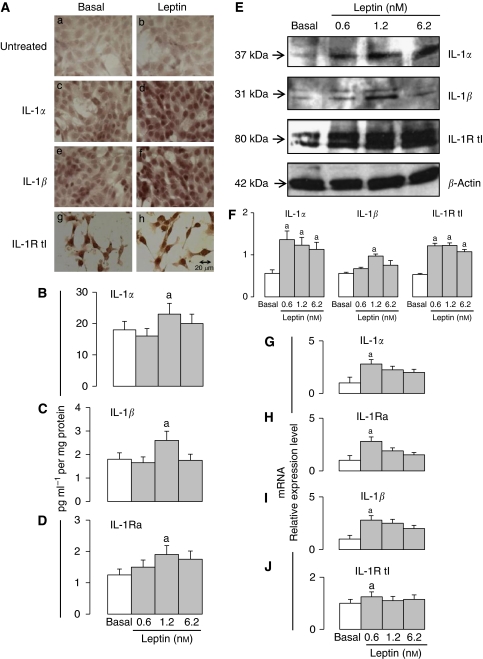
Leptin induces the expression of IL-1 system in 4T1 cells. (A) Representative results of leptin-induced increase in protein levels of IL-1 system as determined by immunocytochemistry (magnification × 40). Control cells in basal conditions: (Aa) no antibodies; (Ac) IL-1α antibodies; (Ae) IL-1β antibodies; (Ag) IL-1R tI antibodies. Cells incubated with leptin: (Ab) no antibodies; (Ad): IL-1α antibodies; (Af) IL-1β antibodies and (Ah) IL-1R tI antibodies. Protein levels of IL-1 ligands (B, IL-1α; C, IL-1β) and antagonist (D, IL-1Ra) as determined by ELISA (pg ml−1 per mg protein). (E), Protein levels of IL-1 ligands and receptor as determined by western blot (WB). (F) WB results were normalised to β-actin as a control and densitometric analysis of bands was carried out with the imageJ software. mRNA levels of IL-1 ligands (G, IL-1α; I, IL-1β), antagonist (H, IL-1Ra) and receptor (J, IL-1R tI) as determined by real-time RT–PCR. GAPDH was used as internal control. 4T1 cells were cultured for 24 h and leptin dose-induced (0, 0.6, 1.2 and 6.2 nM) effects were determined as described (see Materials and Methods). (a) P<0.05 when comparing levels of protein or mRNA to control (basal). Data (mean±s.e.) are representative of the results derived from a minimum of three independent experiments.

