Figure 5.
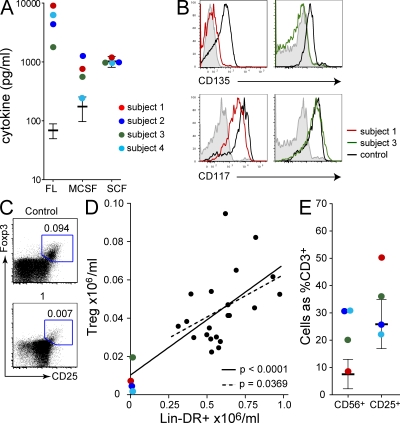
Elevation of Flt3L with T reg cell deficiency. (A) Serum Flt3L, M-CSF, and SCF concentrations measured by ELISA. Each subject was analyzed once. (B) Expression of Flt-3/CD135 and SCF-R/CD117 on BM CD34+ cells of subjects 1 and 3 compared with healthy controls and isotype (filled histogram). Each subject was analyzed twice. (C) Representative example of T reg cell analysis from subject versus normal control. Number indicates absolute count ×106 /ml. (D) Absolute number of CD4+CD25hiFoxP3+ T reg cells compared with HLA-DR+ lineage− (CD3, 19, 20, 56) cells in subjects 1–4, as indicated, and controls (n = 21). Each subject was analyzed once. (E) Proportion of CD56+ and CD25+ CD3+ T cells in subjects 1–4 as indicated relative to controls.

