Figure 6.
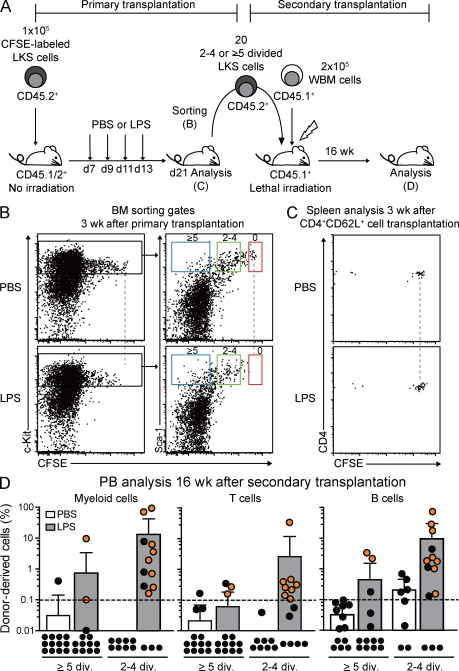
In vivo LPS challenge recruits HSCs into division. (A) Experimental scheme of transplantation and LPS challenge. (B) Representative dot plots gated on donor Lin− cells from BM of primary transplant recipients at day 21 after transfer of CFSE-labeled LKS cells with or without four injections of LPS. Sorting gates for 0×- (red), 2–4×- (green), or ≥5×-divided LKS cells (blue) are shown. Dashed lines represent zero division. (C) Representative dot plots gated on donor CD4+CD62L+ cells from spleen of primary transplant recipients at day 21 after transfer of CD4+CD62L+ cells with or without four injections of LPS. Dashed lines represent zero division. (D) PB donor engraftment within myeloid, T, and B cells 4 mo after secondary transplantation with 20 2–4×- or ≥5×-divided LKS cells from PBS- or LPS-treated mice (B). Pooled data from three independent experiments are shown as dots (representing one mouse each) and a bar graph depicting mean ± SD. Orange dots show the multilineage reconstituted animals. Black dots show animals with one or zero lineages reconstituted. The dashed line at 0.1% shows background threshold set for engraftment cutoff. ND, not detected.

