
Fig. 5.
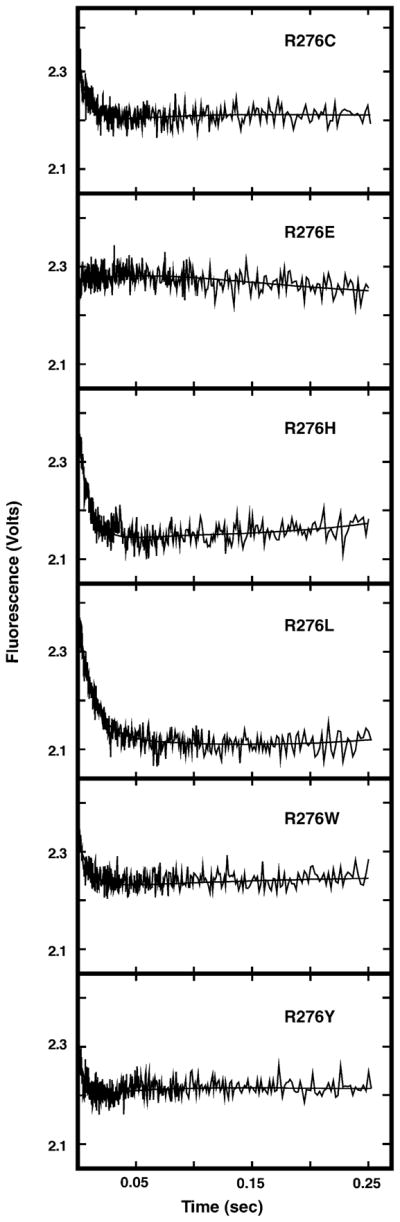
Stopped-flow time trace of Arg276 mutant protein intrinsic fluorescence change upon binding dsU·A-25-mer. Each Arg276 mutant protein (100 nM) was mixed with dsU·A-25-mer (1 μM) in buffer A at 25 °C and the intrinsic protein fluorescence monitored using a stopped-flow spectrometer. Each kinetic trace shown represents an average of 10 individual acquisitions; the identity of the Arg276 mutant protein is indicated in the upper right corner of the time trace. The solid lines represent the best-fit curves to Eq. (2) as described in Section 2.