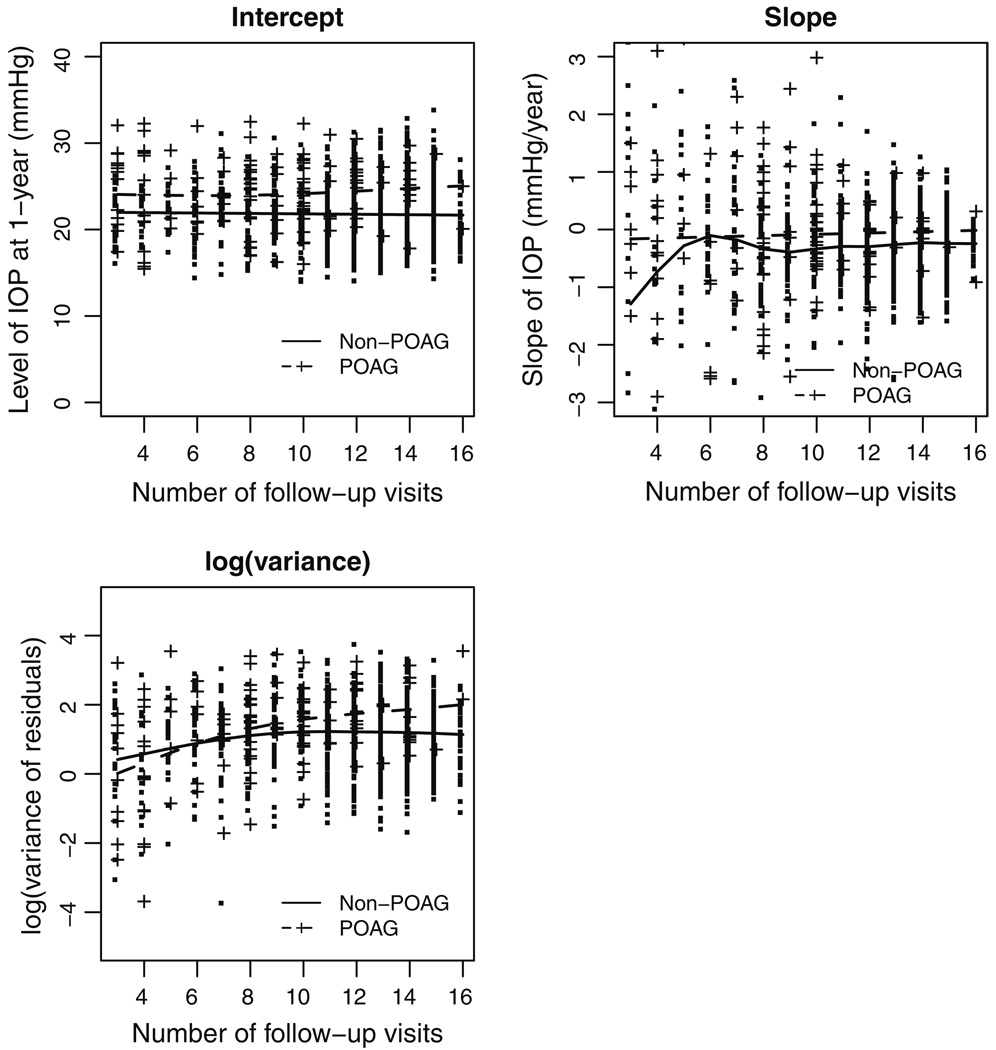
Fig. 1.
Descriptive statistics for follow-up IOP in the OHTS data, where the intercept, slope, and variance of residuals are estimated from the simple linear regression model fit to each patient. Smoothed cubic-splines are imposed to those who have developed POAG (broken line) and those who are free of POAG (solid line) respectively

