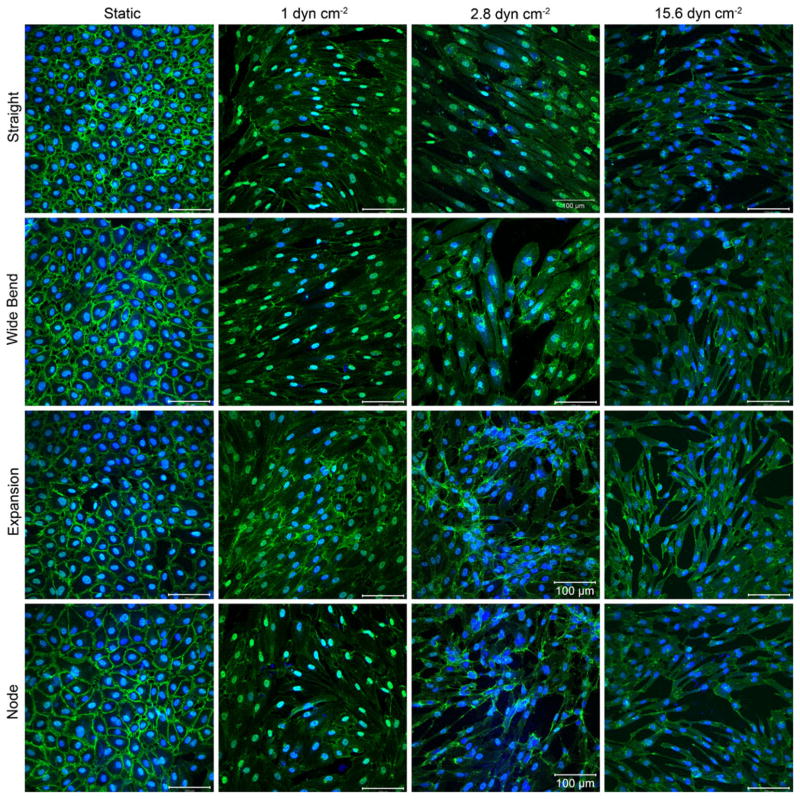
Fig. 4.
The effect of flow on VE-cadherin expression (green) after 2 days of flow in four selected regions of interest. Nuclei are counter-stained in blue. Early in the experimental time course, the effect of increasing flow rates can be seen on the morphology of the endothelial cells. With no flow, VE-cadherin is continuous and well defined. As shear stress increases, expression becomes discontinuous. At the highest shear stress, the amount of VE-cadherin expression also decreased, as compared to static controls. This may be indicative of a transition into disturbed flow as the system is subject to increasingly higher average shear stresses. Scale bars are 100 μm in length

