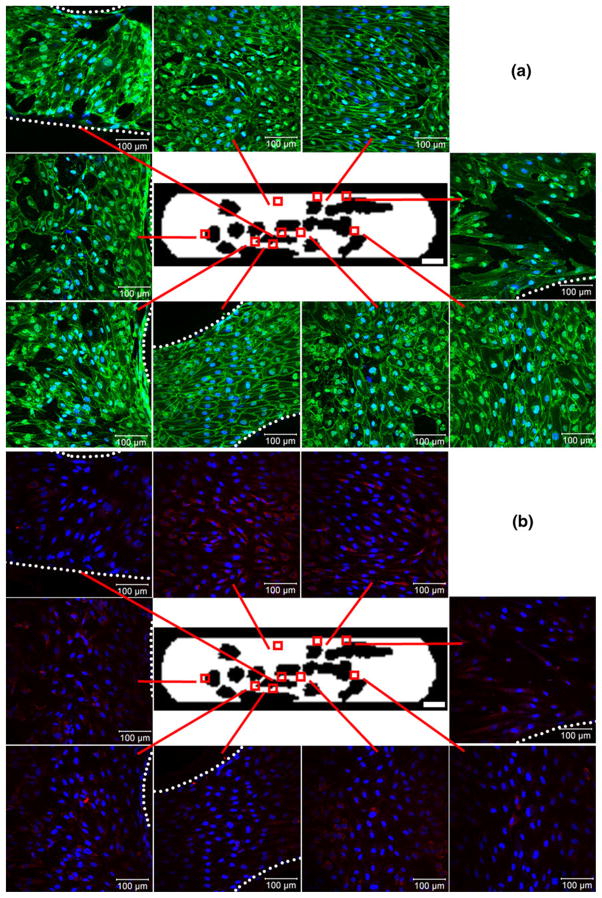
Fig. 5.
VE-cadherin (green, panel (a)) and KLF2 (red, panel (b)) expression at an average shear stress (τ*) of 2.8 dyn cm−2 after 6 days of flow, with nuclei counter-stained blue. Devices were co-stained for both markers and are presented as split images. Each region’s callout shows a confocal image (460 μm×460 μm in size) of the HUVEC lining the bottom surface. The dotted white lines define the PDMS walls that encroached into several regions of interest, beyond which cells were not present. Occasional bare patches and discontinuous VE-cadherin can be seen in the node, large contraction, obstruction and branch regions. KLF2 expression did not appear higher in any particular region. Scale bars within callout images=100 μm while white bars in the bottom right corner of central device images=3000 μm

