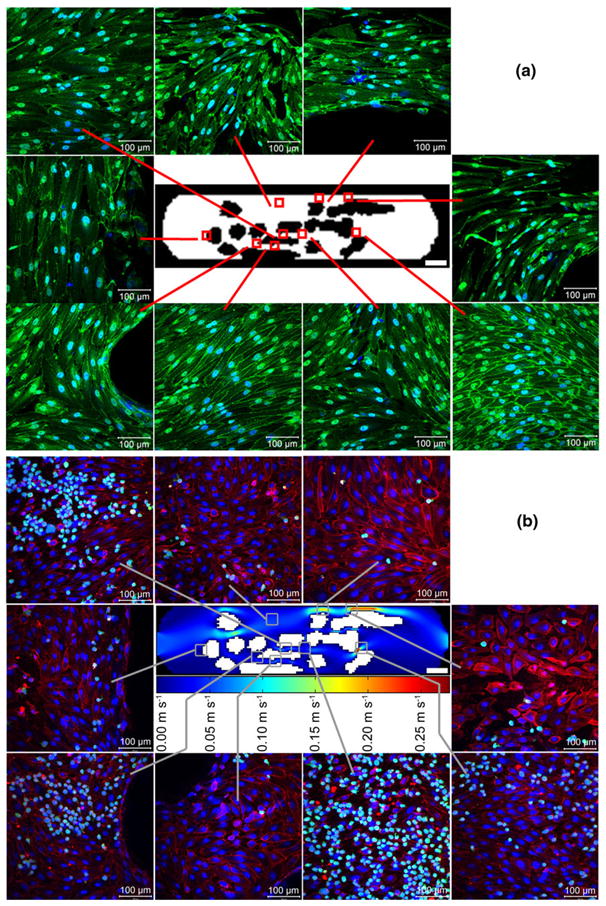
Fig. 6.

(a) VE-cadherin (green) expression at an average shear stress (τ*) of 15.6 dyn cm−2 after 1 day of flow, with nuclei counter-stained blue. For the majority of replicates, cells did not appear well aligned, even in the straight and large contraction regions where streamlines were relatively straight. VE-cadherin expression did not appear higher in any particular region and VE-cadherin appeared discontinuous throughout the entire chamber. Scale bars are 100 μm in length (b) CFDA SE labeled THP-1 adhesion to HUVEC after 1 day at τ*= 15.6 dyn cm−2. THP-1 cells appear green, nuclei appear blue and VCAM-1 appears red; the regional variation in THP-1 attachment (e.g., the high coverage in the node region) is described in the context of Fig. 7. The velocity field at the centre of the panel (by computational modeling) is for a total flow rate of 11 mL min−1 through the circuit corresponding to the 15.6 dyn cm−2 average shear stress. White scale bars within callouts are 100 μm and within the central device image are 3000 μm
