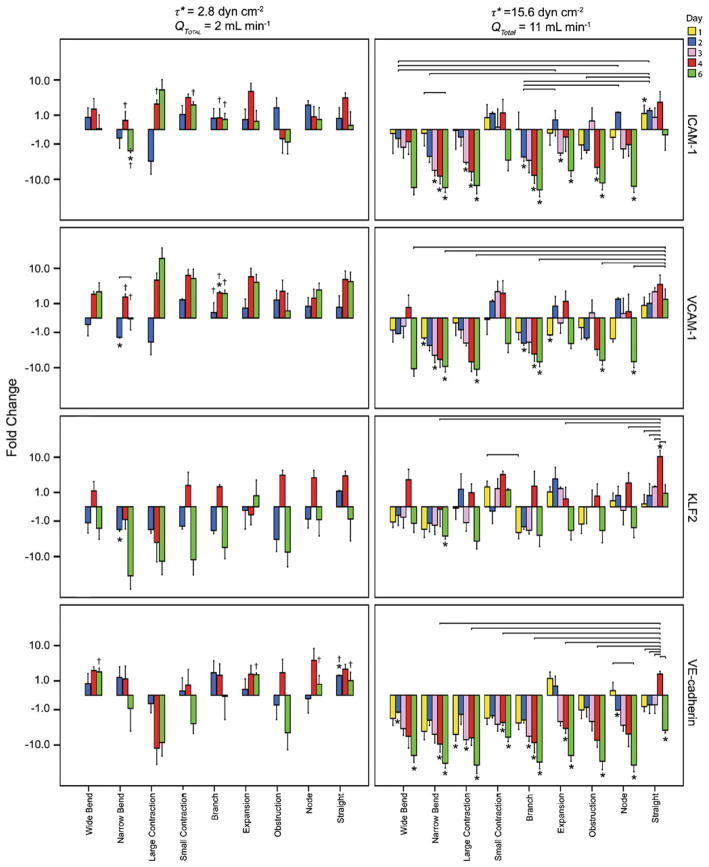
Fig. 9.
The fold change in marker expression (normalized to that observed with a static control in the same region, time and shear stress and displayed on a logarithmic scale for different regions and times) at low and high average shear stresses. The solid connecting lines represent a significant difference in marker expression between days for a given shear stress; † represents a significant difference in marker expression between shear stresses for a given day; and * represents a significant difference in expression between flow cases and static controls (a positive value indicates expression is higher with flow). At the lower 2.8 dyn cm−2 shear stress, virtually no statistically significant differences between flow and static marker expressions were seen in any region (p>0.05). When the average shear stress was at the higher value (15.6 dyn cm−2), flow reduced the ICAM-1, VCAM-1 and VE-Cadherin expression in many regions throughout the time course, as compared to static controls. With the exception of the narrow bend region, KLF2 appeared to be unaffected by the increase in average shear stress. Error bars are 1 s.e.m., n=3 or 4 and p<0.05 for statistical significance

