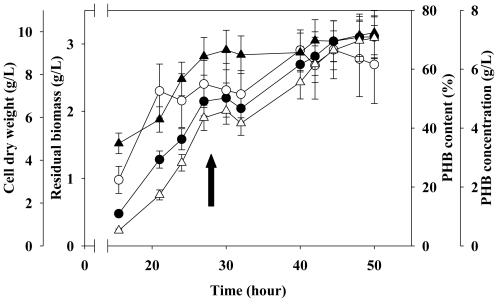
Figure 7.
Time course of PHB production, residual biomass and CDW by C. taiwanensis 184 using nutrient-limiting strategy (n = 3). Closed circle: CDW; Open circle: Residual biomass; Closed triangle: PHB content; Open triangle: PHB concentration. The arrow indicates the starting time for the second stage.

