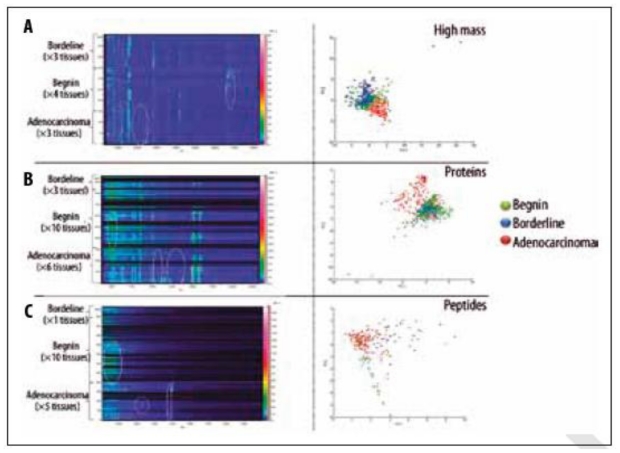
Figure 4.
Figure from El Ayed et al. 2010 showing MALDI-TOF MS profiling on three classes of ovarian tissue (adenocarcinoma, borderline and benign). Plots of m/z against spectral source as well as loadings plots from principal component analysis are included for high mass proteins (A), small proteins (B) and peptides (C). Figure reprinted, with permission, from El Ayed et al. 2010 [30].

