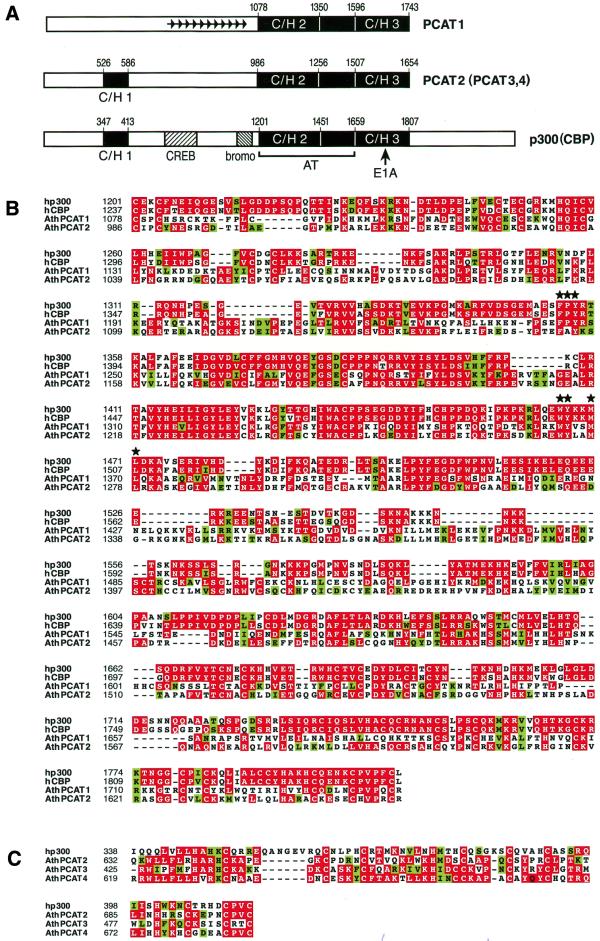
Figure 1.
Identification of p300/CBP-like molecules in the plant A.thaliana. (A) Schematic representations of human p300 (CBP) and PCAT1 and 2 are shown. PCAT3 and 4 are not depicted because they structurally resemble PCAT2. Regions of highest homology are highlighted as black boxes and the amino acids located at the borders of the C/H regions are numbered. Note the absence of the CREB binding region (marked CREB) and a bromodomain (marked bromo) in the plant PCAT proteins. (B) Alignment of the segments encompassing C/H2 and C/H3 regions of human p300, CBP and the two plant proteins PCAT1 and 2. The shading of the multiple sequence alignment was done using the standard settings of the Boxshade 3.21 program. Amino acids are shaded when proteins exhibit similar (green) or identical (red) residues at the respective position according to the rules specified in the documentation to the algorithm of the software: http://www.ch.embnet.org/software/BOX_doc.html. Asterisks above the aligned sequences indicate AT domain residues that were mutated in p300 and PCAT2 in Figure 4. (C) A sequence alignment of the C/H1 regions of hp300 and AthPCAT2, 3 and 4 is shown.

