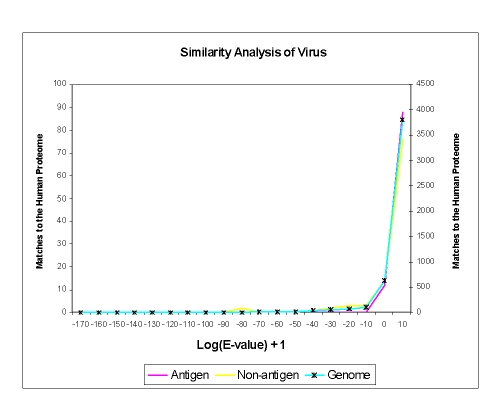
Figure 2.
Viral Sequence Comparison. A sequence similarity comparison with the E-value as 6000 and BLOSUM 62 matrix, between the Antigen, Non-antigen and viral genome sequences. Two separate scales were used as the number of matches to the Human Genome varied from the antigen and non-antigen datasets to the genome. The blue line with the star marker corresponding to the genome is plotted on the scale to the right hand axis (Y axis).

