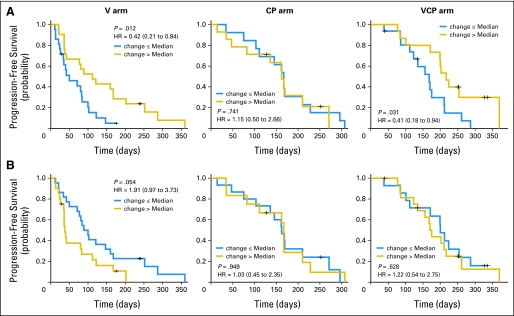
Fig 2.
Kaplan-Meier curves of progression-free survival (PFS) based on extent of change in (A) intercellular adhesion molecule 1 (ICAM-1) and (B) vascular endothelial growth factor (VEGF) concentrations (≤ median indicates increase ≤ the median increase in concentration of that cytokine and angiogenic factor [CAF]; > median indicates increase > the median increase in concentration of that CAF). Note that the P values are from a log-rank test for the comparison of the Kaplan-Meier curves, whereas the P values shown in the text are from a Cox model with the change of the markers as continuous variables adjusting for sex and smoking status. Change in ICAM-1 at day 8 by treatment interaction, P = .021; change in VEGF at day 8 by treatment interaction, P = .009. V, vandetanib; CP, carboplatin and paclitaxel; VCP, vandetanib, carboplatin, and paclitaxel; HR, hazard ratio.

