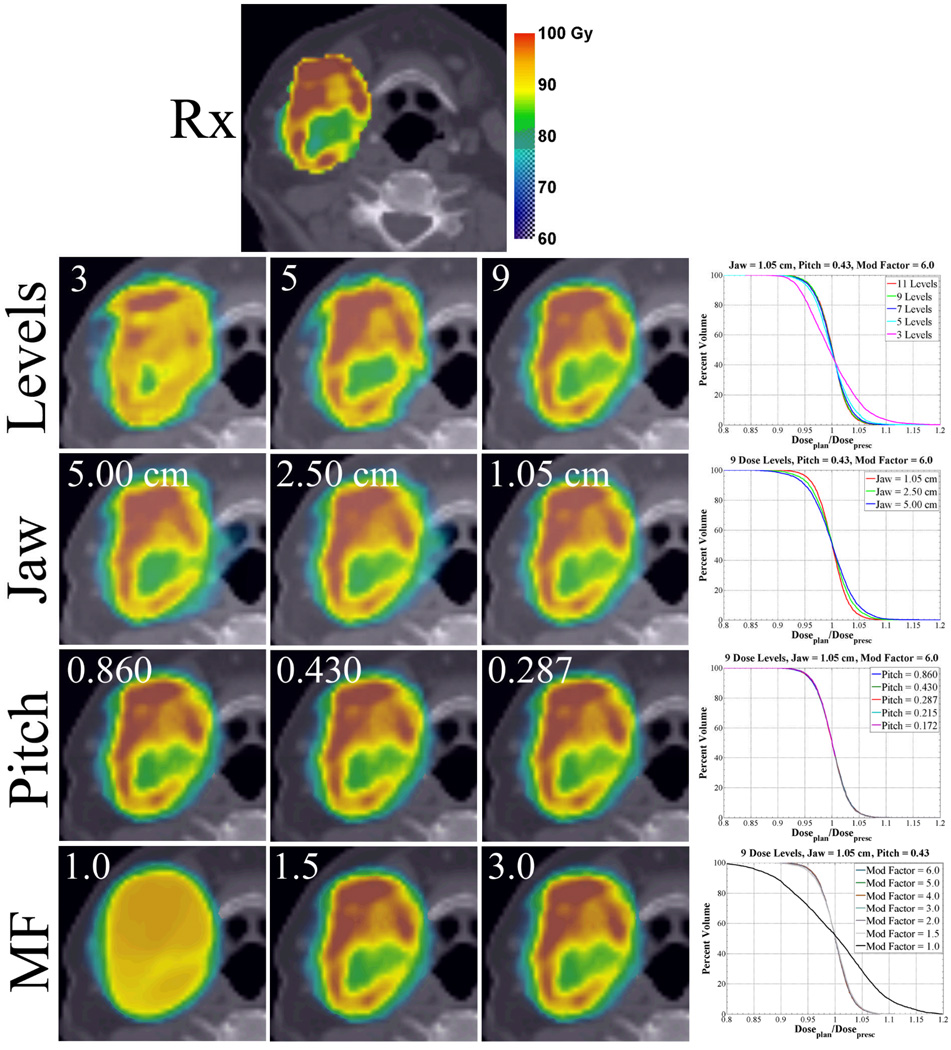
Figure 2. Axial planned dose distributions and QVH plots for varying prescription dose levels and permutations in physical delivery parameters in a head and neck cancer patient.
Variations in plan conformity are quantified by QVH plots. Note that with increasing dose level, increasing modulation factors (MF) up to 2.0, and decreasing jaw width, plan conformity increases. Plan conformity is invariant to changes in pitch.

