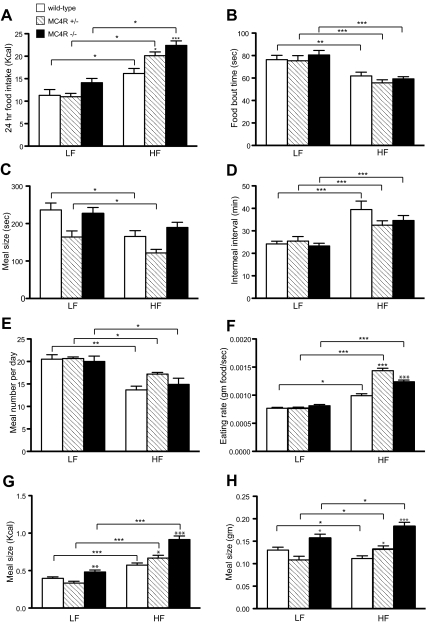
Fig. 2.
Effect of dietary fat on the microstructure of food intake in WT, MC4-R+/−, and MC4-R−/− mice. A, Twenty-four–hour food intake of 3-month-old male mice fed Picolab rodent diet 20 (LF) or D12492 (HF) was monitored by CLAMS (*, P < 0.05; ***, P < 0.001, one-way ANOVA, WT LF = 7, WT HF = 8, MC4R+/− LF = 8, MC4R+/− HF = 8, MC4R−/− LF = 7, MC4R−/− HF = 9). B, Average duration of each feeding bout. C, Duration that animals consumed each meal. Animals (B) and (C) were evaluated during 6 h after light off (*, P < 0.05; **, P < 0.01; ***, P < 0.001, one-way ANOVA). D, Intermeal interval. E, Number of meals. Data in D and E were obtained from the 24-h period on d 3 (***, P < 0.001; *, P < 0.05; **, P < 0.01). F, Eating rate, indicated as gram food consumed per second, was significantly higher in HF-fed MC4R+/− and MC4R−/− mice vs. WT (*, P < 0.05; ***, P < 0.001, one-way ANOVA). G, Meal size, in Kcal, was greater in MC4R−/− vs. WT (*, P < 0.05; **, P < 0.01; ***, P < 0.001, one-way ANOVA). H, Meal size, in g, was significantly decreased in WT animals switched to HF diet, whereas MC4R+/− and MC4R−/− mice increased meal size in response to HF diet (*, P < 0.05; ***, P < 0.001, one-way ANOVA). All data were represented as mean ± sem.

