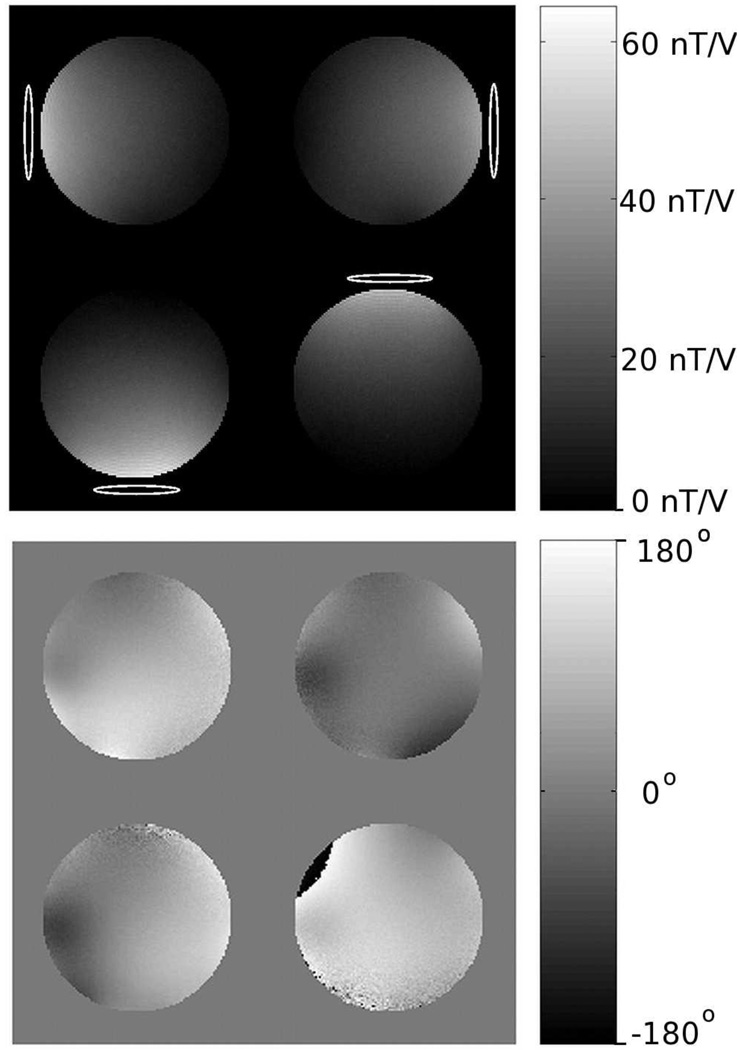
FIG. 3.
Transmitter sensitivity maps showing the (a) magnitude and (b) phase of the B1+ profile. These maps were acquired in a 20 cm diameter spherical phantom with dielectric properties similar to the human brain. All of the pulses were designed using these B1+ maps. Maps of the B1− (not shown) were acquired as well and used during image reconstruction to remove receiver inhomogeneity.

