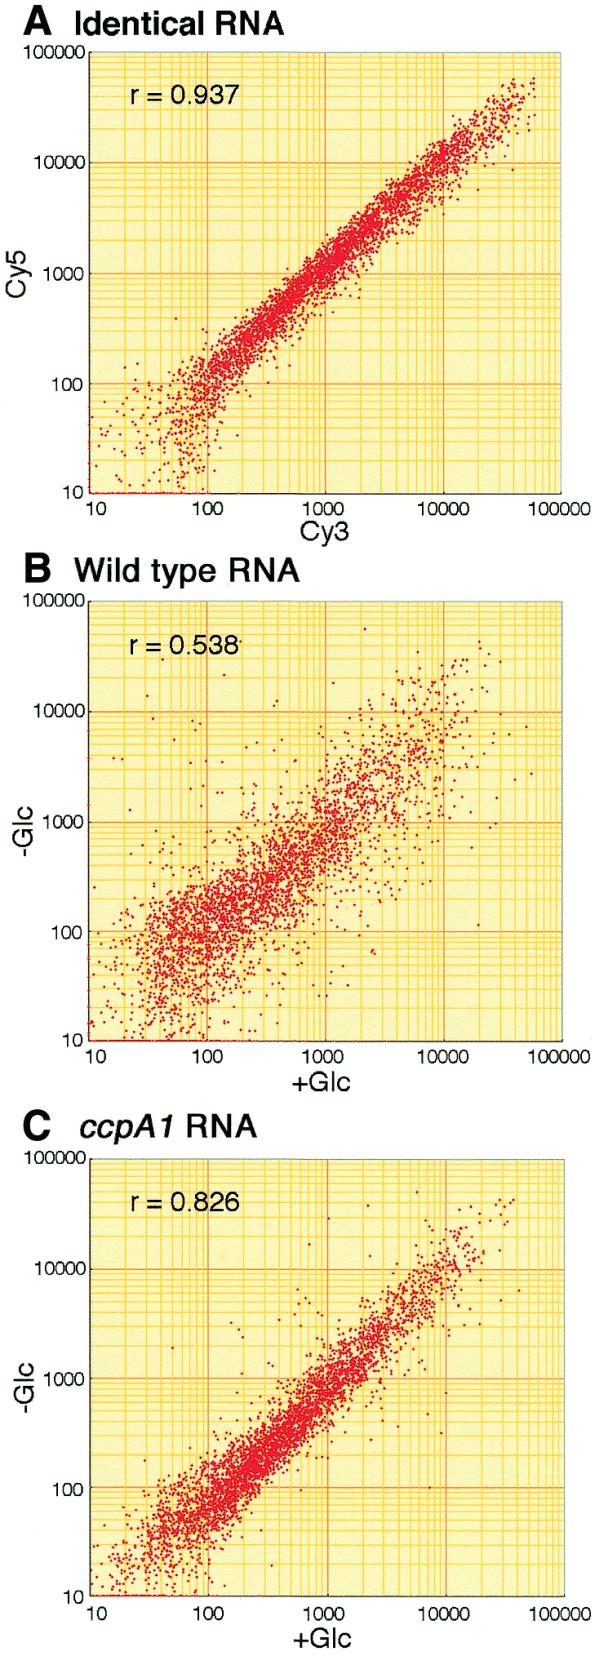
Figure 2.

Logarithmic-scale plots of normalized spot intensities (arbitrary units). Spot intensities were normalized after subtracting their backgrounds, i.e. the average spot intensities of 12 mammal gene spots. After substituting the intensities of less than 10 with that of 10, which was less than the standard deviations of their backgrounds, the intensities were plotted logarithmically. The correlation coefficient is indicated by r. (A) RNA of strain 1A250 (wild-type) grown with glucose was used for both Cy3 and Cy5 cDNA-labeling. After hybridization of microarrays with the Cy3 and Cy5 probes, the respective spot intensities for 4100 genes, calculated as above, were plotted. The backgrounds for Cy3 and Cy5 spot intensities were 244.6 ± 42.7 and 278.2 ± 74.4, respectively. (B) RNA of strain 1A250 (wild-type) grown with and without glucose (Glc) was used for Cy3- and Cy5-labeling, respectively. The backgrounds for Cy3 and Cy5 spot intensities were 189.3 ± 30.4 and 249.5 ± 46.7, respectively. (C) RNA of strain 147 (ccpA1) grown with and without glucose was used for Cy3- and Cy5-labeling, respectively. The backgrounds for Cy3 and Cy5 spot intensities were 186.3 ± 21.5 and 206.7 ± 31.4, respectively.
