
Figure 3.
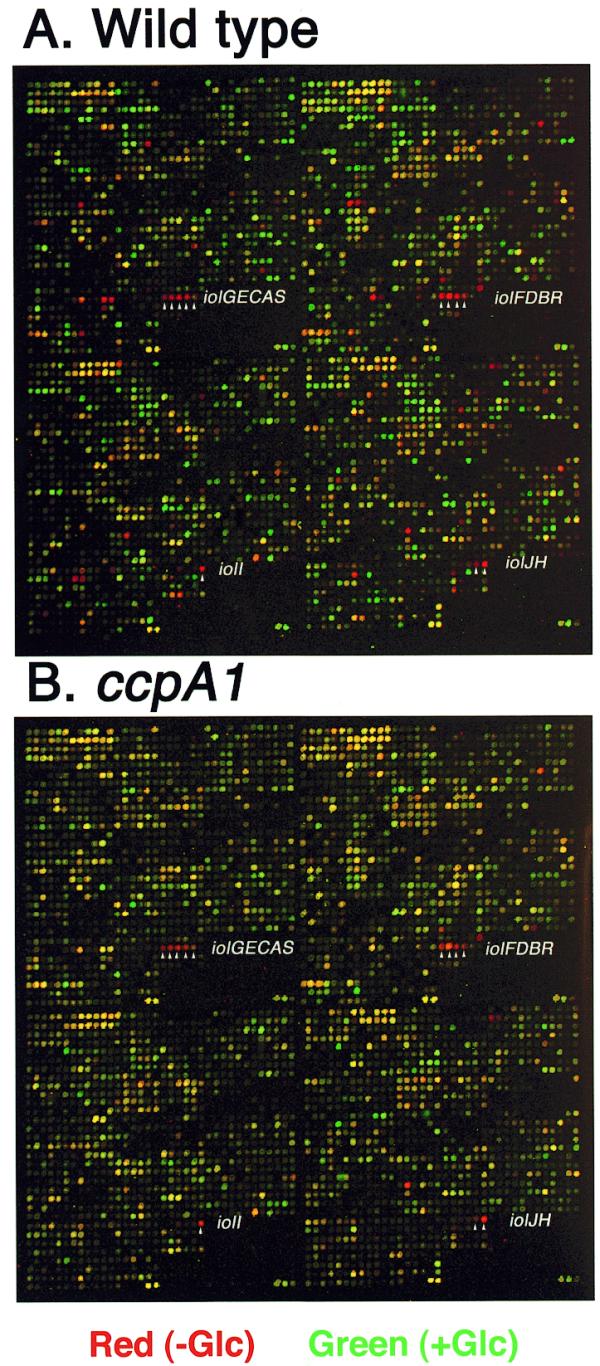
Pseudocolor imaging of glucose-repressive genes. Cy5[–glucose (Glc)] and Cy3 (+ glucose) spot intensities are denoted in red and green, respectively. The red and green images were overlaid, producing pseudocolors for all the spots. Red and green spots correspond to glucose-repressive and -inducible genes, respectively. The 12 iol genes are indicated by white arrowheads. (A) RNA of strain 1A250 (wild-type) grown with and without glucose was used for Cy3- and Cy5-labeling of their cDNAs, respectively (the same analysis as in Fig. 2B). (B) RNA of strain 1A147 (ccpA1) grown with and without glucose was used for Cy3- and Cy5-labeling of their cDNAs, respectively (the same analysis as in Fig. 2C).