
Figure 2.
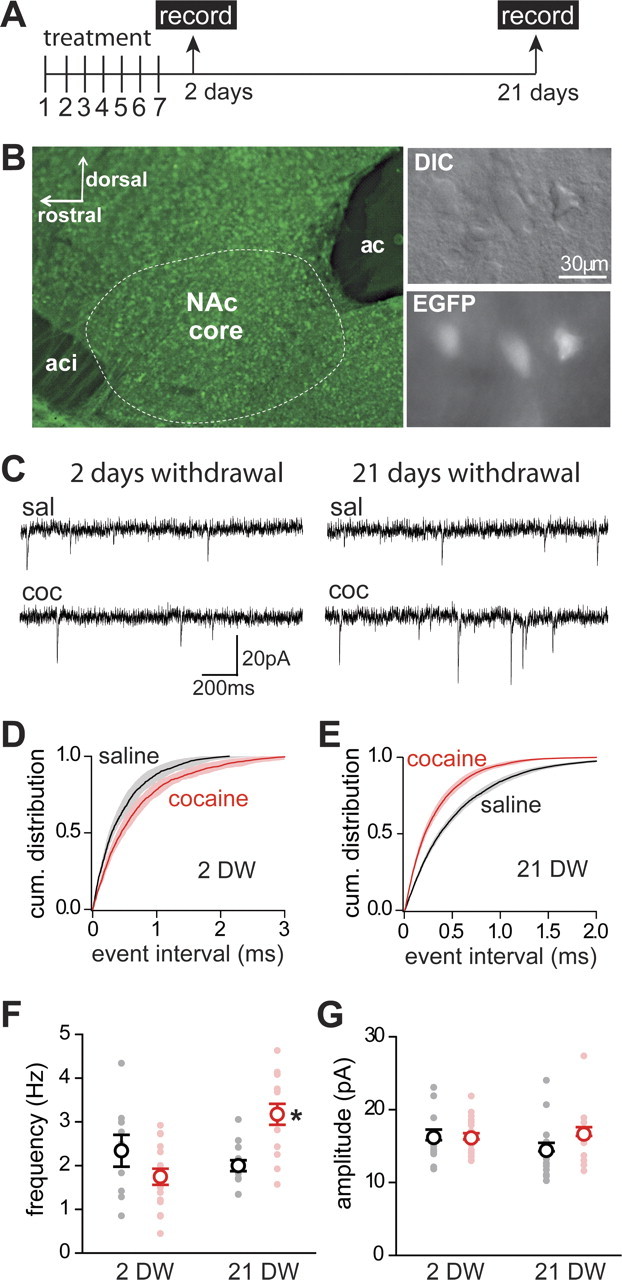
Withdrawal from short cocaine treatment is required for increased frequency of mEPSCs in D1(+) MSNs. A, Time line of short treatment (7 consecutive injections of saline or cocaine) followed by recordings 2 or 21 d after the last injection (arrows). B, Left, Green fluorescence from an acute sagittal slice from Drd1a-GFP mice showing the core subregion of the NAc (dotted line) located between the rostral (aci) and caudal (ac) limbs of the anterior commissure. Right, DIC image (top) of MSNs in a slice identified based on size and the expression of EGFP (bottom). C, Sample recording traces from D1(+) MSNs in saline- and cocaine-treated mice studied at 2 or 21 d after the last injection (groups A and B). D, E, Cumulative distribution of mEPSC interevent time from core D1(+) MSNs in saline-treated (black; n = 11–13 cells, 4 mice) and cocaine-treated mice (red; n = 16 cells, 4 mice; K-S test, p < 0.01) after 2 d withdrawal (D) and 21 d withdrawal (E). The solid lines and shadows represent the mean distribution and ±SEM for each condition, respectively. F, Frequency of mEPSCs of individual cells (filled circle) and mean ± SEM values per condition (open circles) recorded in D1(+) MSNs from NAc core in saline-treated (black) and cocaine-treated (red) mice at 2 d (2 DW) and 21 d (21 DW) of withdrawal. *p < 0.05. G, mEPSC amplitude of individual cells (filled circle) and mean ± SEM values per condition (open circle) recorded in D1(+) MSNs from NAc core in saline-treated (black) and cocaine-treated (red) mice at 2 d (2 DW) and 21 d (21 DW) of withdrawal (n = 11–16 cells, 4 mice).