
Figure 5.
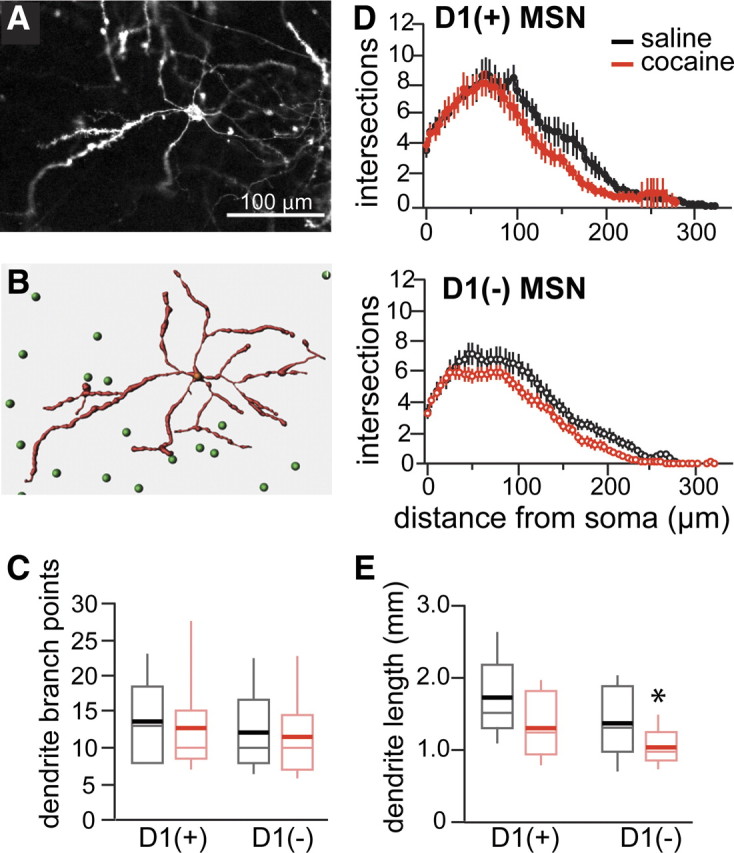
Dendrite morphology after long cocaine treatment without protracted withdrawal. A, Confocal image of a DiI-labeled MSN. B, Model obtained by Imaris software showing a DiI-labeled neuron in red and, in green, the location of the GFP-positive cell soma in the imaged field. C, Dendrite branch points per neuron (mean ± SEM) for D1(+) MSNs and D1(−) MSNs in saline (black)- and cocaine (red)-treated mice. Box plot shows mean (thick line) and median (thin line) for the data of each group (n = 9–10 and 14–17). D, Scholl analysis of dendrite branches for D1(+) (top) and D1(−) (bottom) MSNs in the NAc (core and shell combined) after saline (black) or cocaine (red) treatment. E, Box plots showing mean (thick line) and median (thin line) for the total dendrite length of D1(+) and D1(−) MSNs of saline (black)- or cocaine (red)-treated mice (n = 9–10 and 14–17). *p < 0.01.