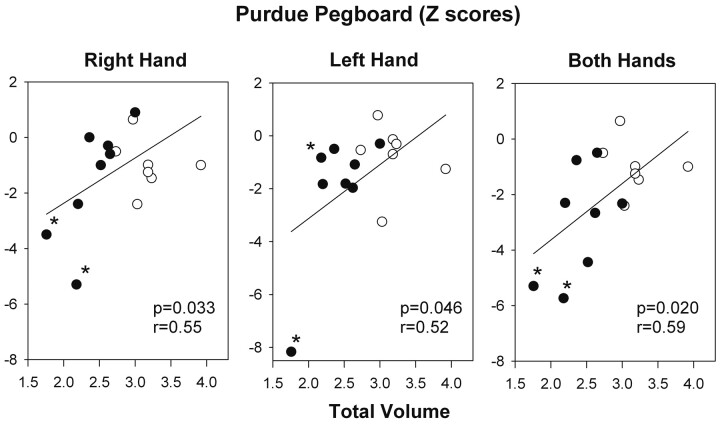
Fig 5.
Relationship between z scores of the Purdue Pegboard Tests and total relative vermal volumes at the 6-month follow-up visit. Results of linear regression analyses are presented. Low vermal volumes in patients with medulloblastoma (labeled with asterisks) were associated with poor performance on the Purdue Pegboard Tests. Filled circles indicate patients; open circles indicate controls.

