
Figure 1.
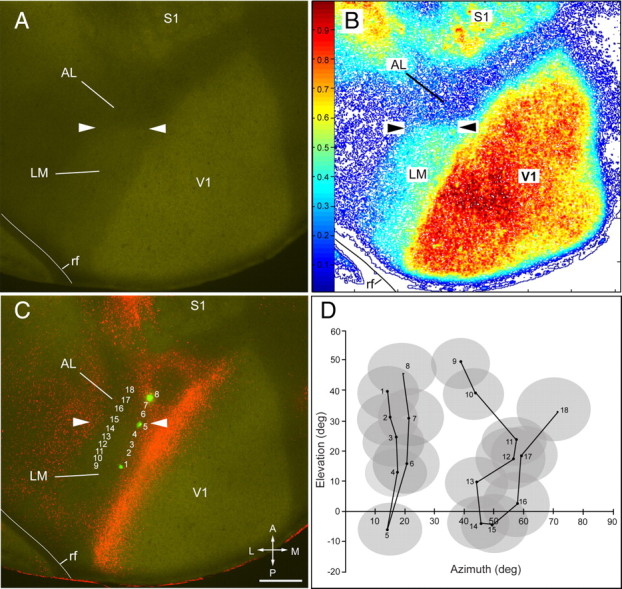
LM/AL border identified by the transition of m2AChR expression coincides with receptive field recordings from lower visual field. A, Expression of m2AChR in a tangential section through layer 4 in left adult visual cortex. The arrowheads mark the LM/AL border between the m2AChR-expressing area LM and the nonexpressing area AL. B, Density contour map of m2AChR expression showing a ≥20% reduction of immunostaining at the LM/AL border (arrowheads). C, D, Overlay of m2AChR with FR-labeled callosal connections. Numbered rows in C indicate recording sites in areas LM and AL. The receptive fields at site 1 (posterior green mark) are in the upper visual field (D), drop to the lower visual field (site 5, middle green mark) at the LM/AL border (C, D, arrowheads), and reverse back to upper fields (site 8, anterior green mark) in AL (C, D). A second series of recordings (sites 9–18) shows a similar trend with a reversal at site 15. Note that the recordings sites 5 and 15 coincide with the transition in m2AChR expression (arrowheads), showing that the LM/AL border represents the lower visual field periphery, which was previously identified as the boundary between areas LM and AL (Wang and Burkhalter, 2007). rf, Rhinal fissure; A, anterior; M, medial; P, posterior; L, lateral. Scale bar, 0.5 mm.