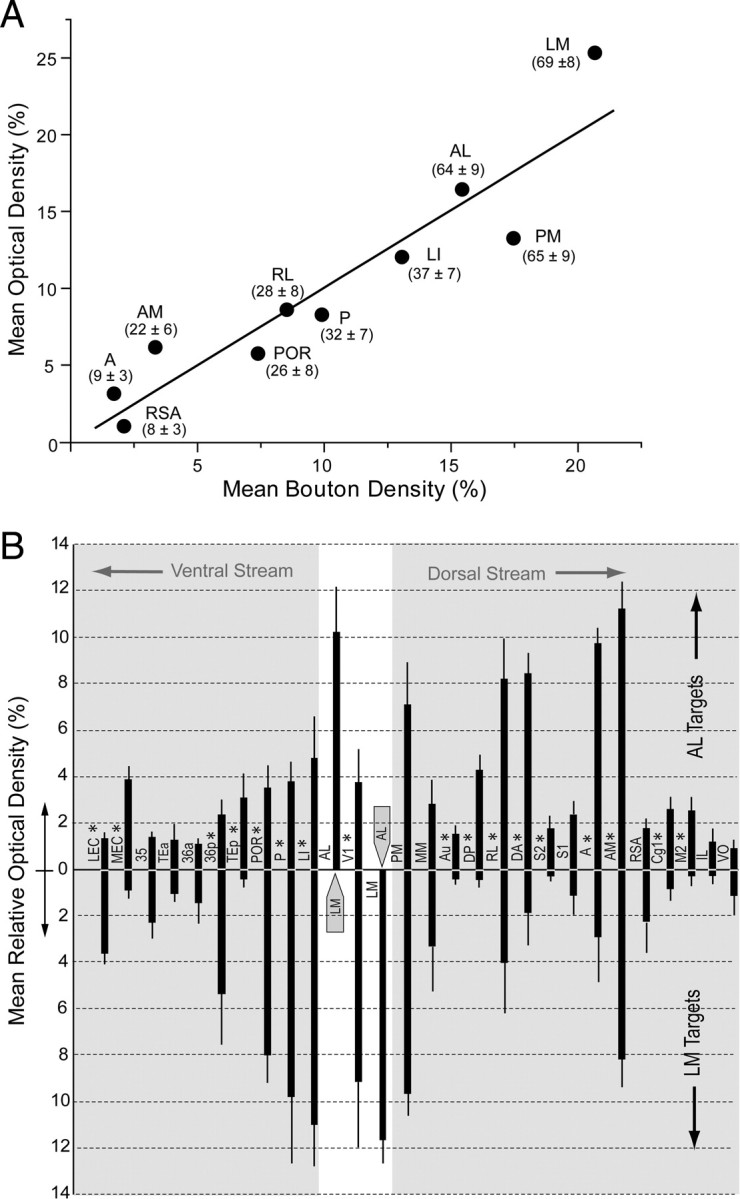
Figure 10.

Relative strengths of inputs from areas LM and AL to targets in ventral and dorsal cerebral cortex. A, Positive significant (R2 = 0.94, p < 0.0001) correlation between average bouton density (3 fields in layers 2–4 per projection in 3 mice) and average optical density (3 fields in layers 2–4 per projection in 3 mice) of BDA-labeled connections in 10 targets of V1. Numbers in parentheses indicate the average ± SEM number of boutons/100 μm2 counted in three sections across each projection field in three mice. B, Relative strength (mean optical density/projection as a percentage of the sum of optical densities of all projections ± SEM) of projections from LM (downward facing bars) and AL (upward facing bars) in different targets of the cortex. Projections from LM more strongly innervate targets in temporal cortex, whereas AL more strongly innervates parietal and frontal cortex, suggesting that LM and AL are gateways to ventral (gray region on the left side) and dorsal (gray region on the right side) streams, respectively. Injected areas LM and AL are indicated by gray arrows. *Significant (p < 0.05) differences.
