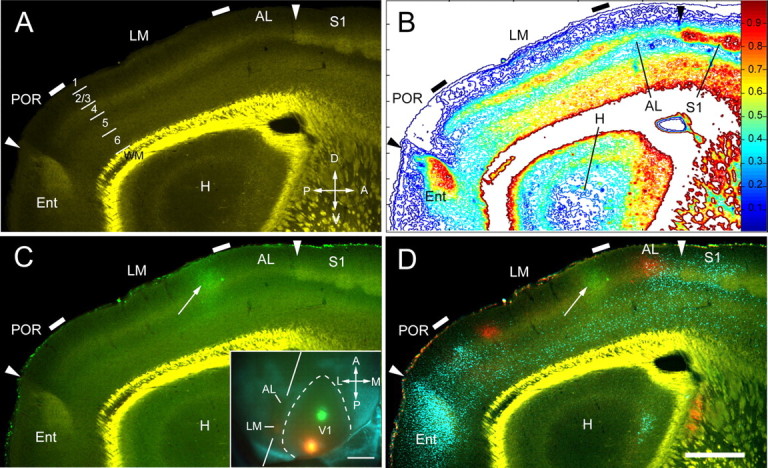
Figure 3.

Chemoarchitectonic LM/AL border shown by m2AChR expression in parasagittal section coincides with V1 inputs from lower visual field. A, m2AChR expression in parasagittal section showing moderate to strong immunofluorescence in layers 1, 2, 4, deep 5, and 6 of areas LM and AL. Note the transition in the thickness of layer 4 at the LM/AL and LM/POR borders (tick marks). The posterior arrowhead indicates the border between POR and entorhinal cortex (Ent). The anterior arrowhead marks the AL/S1 border. Bright yellow represents nonspecific labeling of myelinated fibers in white matter. A, anterior; V, ventral; P, posterior; D, dorsal. B, Density contour map of m2AChR expression showing a ≥20% reduction of immunostaining and a decrease in the width of staining in layer 4 that coincides with the LM/AL border (tick mark). C, Overlay of anterogradely FE-labeled connections from the lower field of V1 shows that the green projection site (arrow) is aligned with a transition in the width of m2AChR staining in layer 4 that coincides with the LM/AL border. Inset, In situ image of green and red injection sites into V1. The blue pattern represents callosal projections. The oblique lines indicate the plane of quasi parasagittal sectioning. A, anterior; M, medial; P, posterior; L, lateral. Scale bar, 1 mm. D, Overlay of m2AChR expression (faint green/yellow staining) with V1 projections from lower (green, FE) and upper (red, FR) fields and callosal connections (blue, bisbenzimide). Note that the green projection (arrow) coincides with the LM/AL border (tick mark). The posterior red projection is near the posterior border of the acallosal region (i.e., border with POR), whereas the anterior red projection falls into AL. The bright yellow color represents nonspecific staining of white matter. H, Hippocampus; Ent, entorhinal cortex. Scale bar, 0.5 mm.
