Abstract
A variable density spiral method is presented for reducing three-dimensional tailored RF pulse duration. Pulse length reductions of 24-32% are possible with no loss in excitation resolution at the expense of a 3-5% increase in slice profile non-uniformity. The method is demonstrated using simulations, phantom experiments, and T2*-weighted images of brain regions with susceptibility induced intravoxel dephasing. Four 13.2 ms shots were needed to excite a 5 mm thick slice with reduced susceptibility artifact in the sinus region at 3T.
Keywords: Variable density spirals, tailored RF pulses, susceptibility artifacts, functional MRI
INTRODUCTION
Functional MRI (fMRI) using blood oxygen level dependent (BOLD) T2* contrast (1,2) is of current interest in both the imaging and neuroscience communities. However, the long echo times required for BOLD T2* contrast make the images prone to artifacts from magnetic susceptibility variations near air/tissue boundaries. Numerous methods have been proposed to mitigate susceptibility artifacts in T2*-weighted imaging, including data post processing (3), gradient compensation (4,5), thin slice averaging (6), and tailored RF pulses (7-10). Specifically, three-dimensional tailored RF (3D TRF) pulses are a promising technique due to their potential for the correction of intravoxel dephasing susceptibility artifacts in specific anatomical regions. The primary drawback of the 3D TRF pulse method is that pulse lengths on the order of 80 ms are required for a single-shot implementation.
This significance of this paper is that it demonstrates that variable density spiral methods (11) can be implemented to reduce the lengths of 3D TRF pulses designed using the small tip angle approximation (12). The rationale for a variable density excitation k-space trajectory is analogous to that used for acquisitions: by sampling the center of k-space uniformly and the edges with reduced density, the resultant aliasing will be minimal due to the predominance of the k-space weighting being at low spatial frequencies. Therefore, one can trade off pulse length for a small penalty in increased aliasing using variable density trajectories. Below we present simulations, phantom experiments, and a demonstration in-vivo of variable density 3D TRF pulses used for reducing the through-plane intravoxel dephasing artifact in T2*-weighted imaging applications. We find that pulse length reductions on the order of 24-32% are possible with a 3-5% increase in slice non-uniformity in these applications.
THEORY
The RF field B1(t) as a function of time t can be written as
| [1] |
Here Δ(t) is the inverse sample density (13), G(t) are the gradients applied simultaneously with B1(t), and M(r) is the desired complex transverse magnetization. The vector k(t) is determined by the gradients area between t and the end of the pulse T. The term -ω(r)TE is explicitly included for T2*-weighted imaging applications to represent minus the linear component of the spatially dependent phase at TE due to susceptibility related field inhomogeneity. In many brain regions, such as above the sinus, the dominant contribution to ω(r) will be linear along the z-axis. The echo time TE is defined as the time between when the center of k-space is excited and when the center of k-space is acquired. Any arbitrary analytical or numerical form for M(r) can be used provided that sampling requirements are satisfied for the resolution and FOV of the excitation. For example, the analytical form of an azimuthally symmetric cylinder (a “slice”) can be created using a “circ” function for ρ multiplied by a Gaussian for z:
| [2] |
Here z0 is the slice thickness and ρ0 is in-plane radius of the disk. The function circ(ρ/ρ0) is defined as being 0 when ρ > ρ0 and 1 when ρ ≤ ρ0.
The primary drawback of the 3D TRF method is that long pulse lengths are needed to excite with a high resolution and/or large FOV. The minimum resolution determines how defined the slice profile is and how fine the variations in magnitude and phase are through its volume. The FOV determines the locations of the replicas (sidelobes) of the slice. Variable density spirals have been used to reduce the length of readout gradients by sampling the center of k-space uniformly and the edges with a lower density at the expense of increased aliasing of the high-spatial frequencies. The resolution of the resultant image can be optimized by weighting by the inverse sample density (14). These arguments used for readout trajectory considerations are also applicable to low tip angle excitations where the inverse sample density weighting is the term Δ(t) in Eq. [1] above.
METHODS
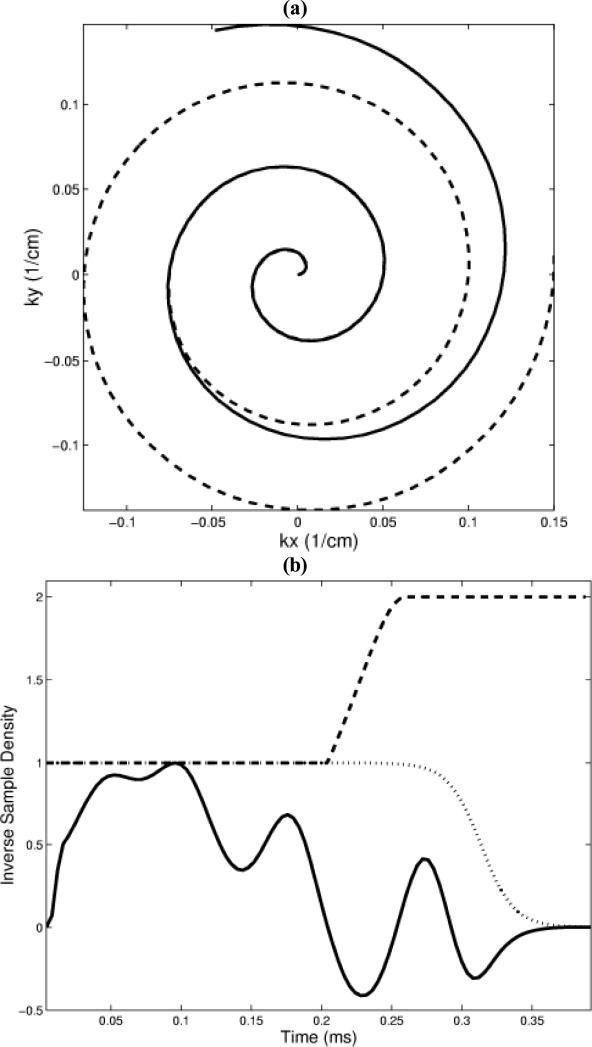
Variable density spiral 3D TRF pulses were designed for a 3T GE LX (General Electric Medical Systems, Milwaukee, Wisconsin) scanner running under VH2 with a 150 T/m/sec gradient slew rate and a 40 mT/m peak gradient. The excitation FOV along the xyz-directions was fixed at 20×20×10 cm3, sufficient to place the sidelobes of a centrally located slice outside of either an 18 cm diameter phantom or a typical human head. The resolution of the pulses as well as the slice thickness varied depending on the application (described below). The general form of the magnetization was given by Eq. [2] and the flip angle was defined by scaling the area of the RF magnitude to the standard sinc pulse used in pre-scan. The variable density spiral gradient waveforms were generated numerically using the gradient peak and slew rate as optimization constraints and were parameterized by three numbers that represented the number of points of the constant, transitional, and undersampled regions. All of the variable density trajectories had approximately constant sampling for the central half of k-space and an undersampling of 2.0 for the outer half. The transition between the constant and variable densities was linear, using the fewest number of points allowable by the gradient hardware. The sampling time for each point was 4 μs. Figure 1 (a) shows an example of a variable density spiral trajectory. The RF waveforms for each spiral were multiplied by Δ(t) to maintain resolution at the expense of SNR. A Fermi filter with a radius of approximately 0.8 of the length of the spiral was used to help reduce truncation artifact by forcing the high frequency end to zero. Figure 1 (b) shows an example of the real part of the RF, Δ(t), and the Fermi filter for one blip of the 3D TRF pulse. The pulses could be implemented either in a single-shot modality, where the sequence of spirals was “out-out,” or in a multi-shot skip-kz modality, where the sequence of spiral was “out-in.” The pulses were generated off-line using Matlab (The MathWorks, Inc., Natick, MA) and inserted into a standard spiral pulse sequence used for routine T2* weighted applications such as fMRI.
Figure 1.
(a) Diagram of constant (dashed line) and variable density (solid line) spiral trajectories used for the 3D TRF pulses. (b) Real part of RF (solid line), inverse of sample density (dashed line), and Fermi filter (dotted line) for one blip. These variable density spirals and filters were used in the construction of the pulse shown in Fig. 2.
Simulation and phantom experiments were performed to examine the effects on excitation resolution and decreased SNR. The simulations calculated the excitation point-spread function numerically for three single-shot pulses. Two were constant density pulses with 1.0×1.0×1.0 and 0.75×0.75×1.0 cm3 resolutions and 41.5 ms and 32.7 ms lengths. The third was a variable density pulse with a 0.75×0.75×1.0 cm3 resolution and 32.6 ms length. The constant density spirals had 1490 and 970 points and the variable density spiral had 748/50/168 constant/transitional/undersampled points. Equation [2] was used to approximate the excitation point-spread function as a 0.25 cm radius 1.0 cm thickness cylinder. A flip angle of 45° was used. The phantom experiment imaged slices excited in an 18 cm diameter silicone gel sphere. Four-shot 3D TRF pulses were designed using Eq. [2] with the addition of a mask that produced the writing “MR NO KA OI,” Hawaiian for “MR is Number One.” (These images were originally presented at the Tenth Scientific Meeting of the International Society of Magnetic Resonance in Medicine in Honolulu, Hawaii, 2002). The slice thickness z0 was 2.0 cm, radius ρ0 was 9.0 cm, TE was 25 ms, and a flip angle of 45° was used. Three different pulses were designed. The first had a 48.3 ms shot length and used constant density spirals (2991 points, 12.0 ms length) with a 4.2 mm resolution. The second had a 32.9 ms shot length and used constant density spirals (2027 points, 8.1 ms length) with a 6.3 mm resolution. The third also had a 32.5 ms shot length but used variable density spirals (1000/50/957 points, 8.0 ms length) with a 4.2 mm resolution. The pulse parameters for the simulations and the phantom experiments were chosen such that the variable density pulses had the same length as the lower resolution constant density pulses and the same resolution as the longer constant density pulses. The variable density pulses were approximately 32% shorter than the constant density pulses of comparable excitation resolution.
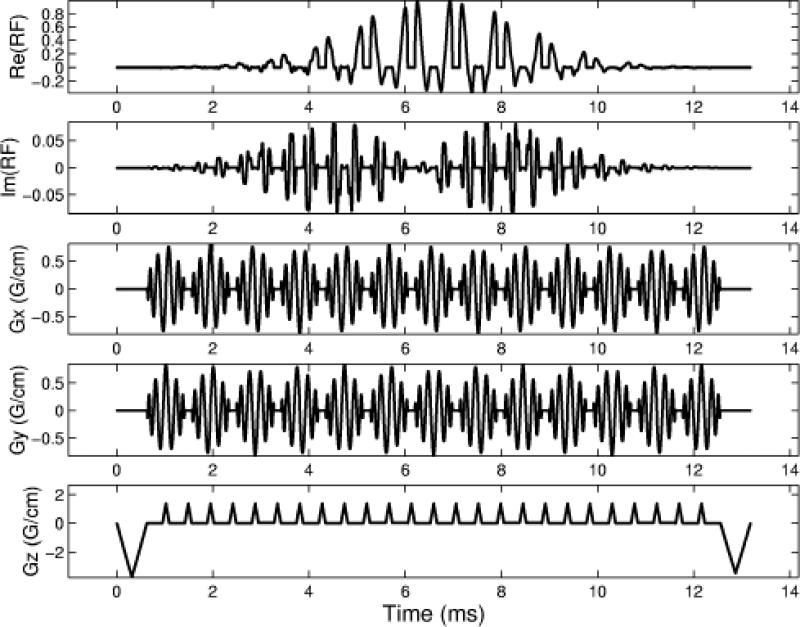
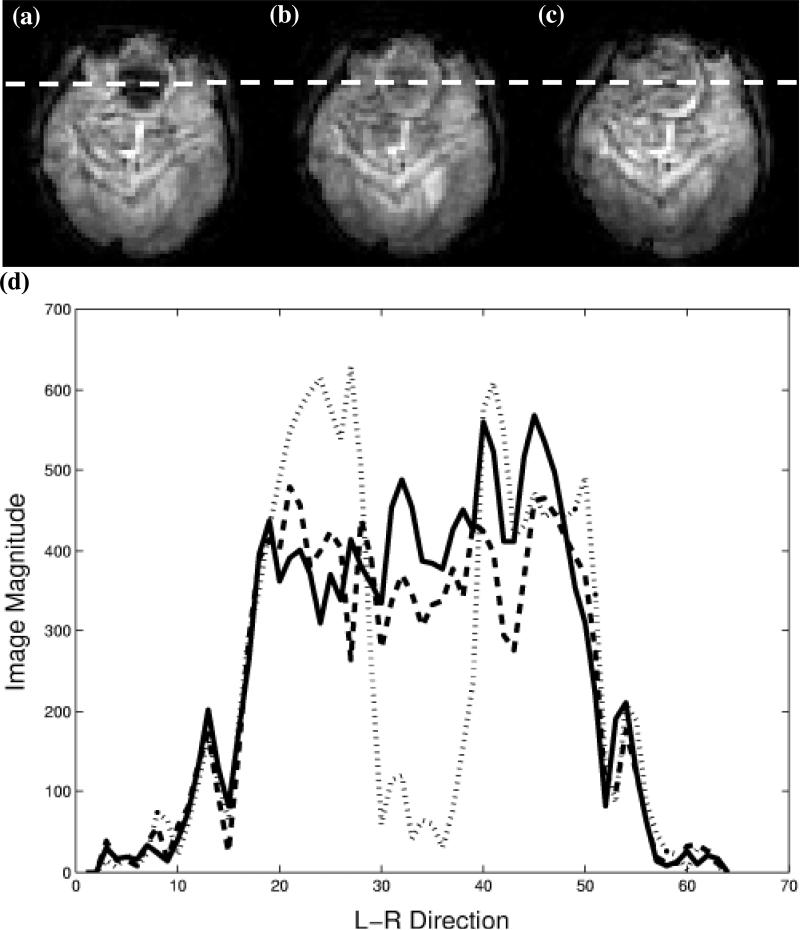
Human brain images were also acquired to test the method in-vivo. Four-shot constant and variable density 3D TRF pulses were designed to excite an axial slice above the sinus at a 30 ms TE at 3T. The slice was positioned such that a significant through-plane dephasing artifact would be present. The resolution of the pulses was 3.4×3.4×0.1 cm3, the slice thickness z0 was 5 mm, and ρ0 was 9 cm. The constant density pulse (139 point spirals) had a 17.4 ms shot length and the variable density pulse (50/16/32 point spirals) had a 13.2 ms shot length (24% shorter). The TR of the acquisition was 1 sec and a flip angle of 60° was determined from calculating the Ernst angle. The magnetization profiles with the through-plane phase correction for the 3D TRF was approximated using analytical functions as described previously (9,10). Figure 2 shows the variable density pulse with through-plane phase correction. The basic procedure during the scan was to first acquire a sagittal scout to position the 3D TRF axial slice. The magnitude and location of the phase correction was determined by inspection of the resultant images. A two-shot spiral was used for the acquisition (64×64 matrix) to minimize in-plane susceptibility effects. Four normal human volunteers were studied.
Figure 2.
Diagram of one shot from a four-shot variable density spiral 3D TRF pulse used for the T2*-weighted imaging results in Fig. 5. This pulse was tailored to reduce through-plane intravoxel-dephasing from the sinus.
RESULTS
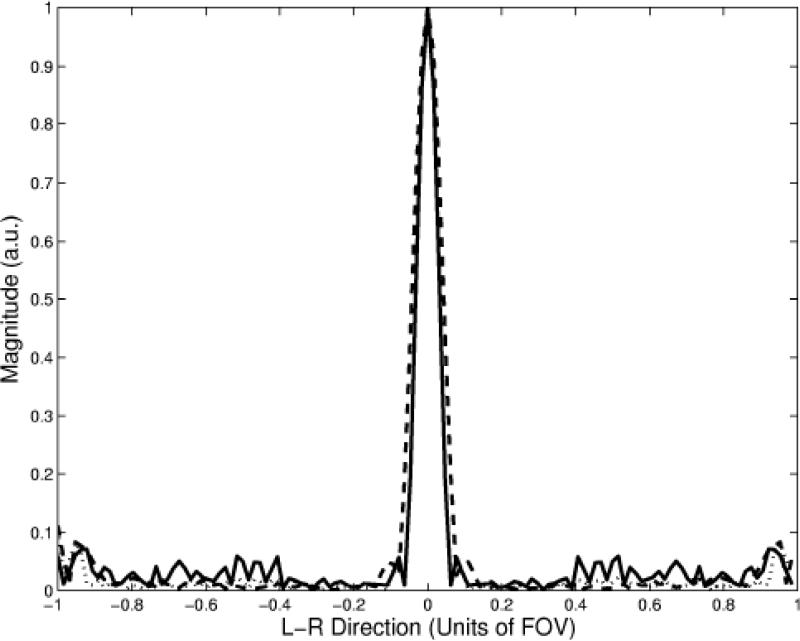
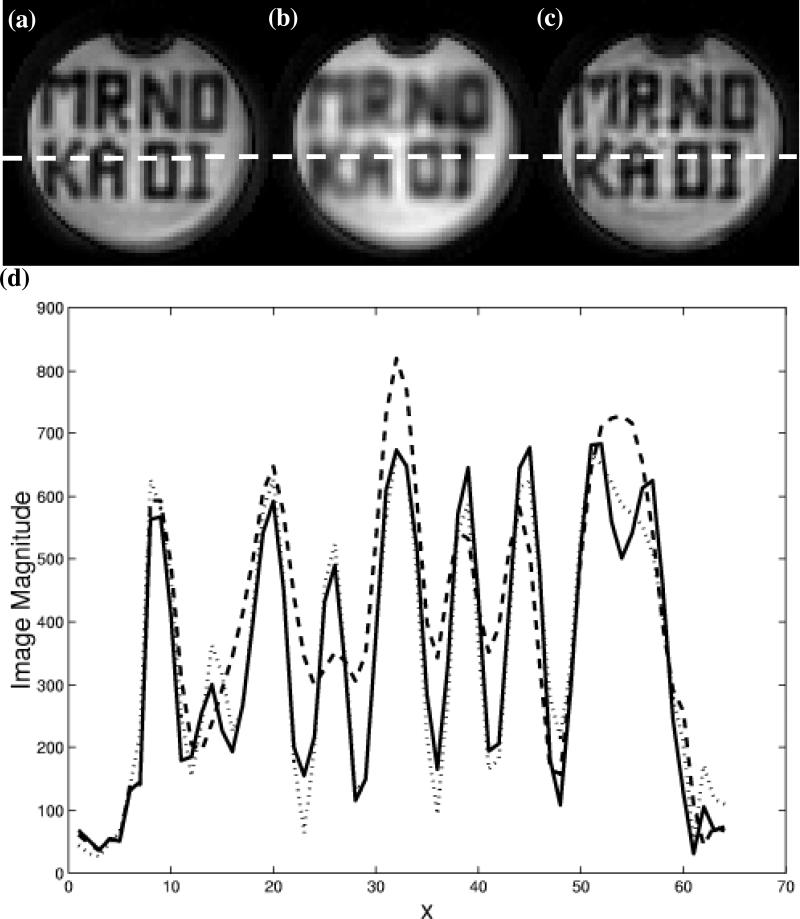
Figure 3 shows the results of the numerical simulations of the excitation point-spread function for the 0.75 cm xy-resolution constant (dotted line), the 1.0 cm xy-resolution constant (dashed line), and the 0.75 cm xy-resolution variable (solid line) density pulses. Only the xy-plane of the 3D excitation was simulated. The results show that the width of the excitation point-spread function for the variable density pulse is the same as the longer constant density pulse, however there is an increase in aliasing of approximately 3-5% in the magnitude near the edges of the FOV. Figure 4 show examples of the axial slices excited in the uniform phantom using the constant (a, b) and variable density (c) pulses described above. The letters tailored into the slices by the pulses can be seen in all three images, however the lettering is more blurred using the lower resolution excitation (b). The resolution of the lettering in (c) is comparable to that of (a) but with decreased slice uniformity due to aliasing of the high-spatial frequencies in the excitation profile. To observe this more quantitatively, Fig. 4 (d) shows profiles along the L-R direction of the images as indicated by the dotted line in (a-c). The shorter variable density pulse excites a slice profile that is very comparable in resolution to the longer constant density pulse. By taking the standard deviation of an ROI in a location where the signal was desired to be uniform in images (a) and (c), the increase is slice variability was measured to be 5% greater in image (c) (similar to the simulations).
Figure 3.
Numerical simulations of the excitation point-spread function for 0.75 cm xy-resolution constant (dotted line), 1.0 cm xy-resolution constant (dashed line), and 0.75 cm xy-resolution variable density (solid line) spiral 3D TRF pulses.
Figure 4.
Slices excited in uniform phantom by constant and variable density spiral 3D TRF pulses. The slices were tailored with “MR NO KA OI” (Hawaiian for “MR is number one”). (a) Slice excited using constant density pulse with 0.44 cm xy-resolution and 43 ms length. (b) Slice excited using constant density pulse with 0.625 cm xy-resolution and 25 ms length. (c) Slice excited using variable density pulse with 0.44 cm xy-resolution and 25 ms length. (d) Profile along dotted line in (a-c). The dotted, dashed, and solid lines correspond to (a), (b), and (c), respectively.
Figure 5 shows examples of axial human brain slices excited using the constant and variable density spiral multi-shot 3D TRF pulses. Figure 5 (a) and (b) show slices excited using the constant density pulse without and with a localized through-plane phase correction, respectively. By inspection, the slice shown in (b) has recovered image magnitude in the sinus compared to the signal void in the slice shown in (a). Figure 5 (c) shows the same slice excited using the variable density pulse with the through-plane phase term. Figure 3 (d) shows profiles along the L-R direction the images as indicated by the dotted line in (a-c). These profiles show that the shorter variable density pulse provides a comparable degree of signal recovery to that of the longer constant density pulse.
Figure 5.
Brain images demonstrating susceptibility artifact reduction using variable density spiral 3D TRF pulses. (a, b) Slices excited using 17.4 ms constant density pulse without and with through-plane correction, respectively. (c) Slice excited using 13.2 ms variable density pulse with through-plane correction. (d) Profile along dotted line in (a-c). The dotted, dashed, and solid lines correspond to (a), (b), and (c), respectively.
DISCUSSION AND CONLUSIONS
This work demonstrates that variable density spirals can be implemented in the excitation domain to reduce 3D TRF pulse lengths. Reductions of 24-32% are possible with an approximate 3-5% increase in slice non-uniformity. Although we only show results where the sample density was 1.0 for the central region of k-space and 0.5 for the outer regions, other parameterizations were implemented. We found that this parameterization gave us the most consistent images with the least noticeable degradation in the slice profiles. The degree to which the variable density spirals can reduce overall pulse length is dependent on how much x-y resolution is needed compared to that along the z-direction. A larger reduction in pulse length was obtained in the simulation and phantom examples than in the intravoxel dephasing artifact reduction examples. Variable sampling density can be introduced along kz by modification of the blip area (15). However, the assumption that the center of k-space contains the majority of weighting is not valid for the susceptibility mitigating pulses because shifting the RF weighting along kz is used to produce the phase correction.
Multiple shots were needed for susceptibility artifact reduction at 3T. We used four variable density spiral 3D TRF shots of length 13.2 ms to excite a 5 thick slice with a 20×20×10 cm3 FOV and 3.4×3.4×0.1 cm3 resolution. These are approximately the minimum sampling requirements needed for reducing artifact in a central slice without using a technique to remove the sidelobes. The 10 cm FOV along z may be too small for a more inferior slice; however, a superior slice does not need through-plane phase correction and pulse resolution can be traded for a larger FOV. Although we used four shots above, it would have been possible to use two 26.4 ms shots or one 52.8 ms shot. Corrections for distortions in the slice profile due to off-resonance effects would need to be considered in a two- or one-shot implementation. We are currently exploring different avenues to reduce pulse lengths. Techniques such as UNFOLD (16) and transmit SENSE (17,18) are both natural choices for reducing the number of shots and future work will address these. We are also implementing techniques that address the in-plane distortions, such as reversed spirals (19) or asymmetric spin-echoes (20), which can be used in conjunction with the 3D TRF through-plane correction.
Acknowledgments
Supported by Whitaker Foundation RG-00-0365, NIMH 1 R01 MH66066-01, and NIDA 1 R21 DA015900-01.
REFERENCES
- 1.Belliveau J, Kennedy D, McKinstry R, Buchbinder B, Weisskoff R, Cohen M, Vevea J, Brady T, Rosen B. Functional mapping of the human visual cortex by magnetic resonance imaging. Science. 1991;254:716–719. doi: 10.1126/science.1948051. [DOI] [PubMed] [Google Scholar]
- 2.Ogawa S, Tank DW, Menon R, Ellerman JM, Kim S-G, Merkle H, Ugurbil K. Intrinsic signal changes accompanying sensory stimulation: Functional brain mapping with magnetic resonance imaging. Proc Natl Acad Sci USA. 1992;89:5951–5955. doi: 10.1073/pnas.89.13.5951. [DOI] [PMC free article] [PubMed] [Google Scholar]
- 3.Noll D, Pauly J, Meyer C, Nishimura D, Macovski A. Deblurring for non-2D Fourier transform magnetic resonance imaging. Magn Reson Med. 1992;25(2):319–333. doi: 10.1002/mrm.1910250210. [DOI] [PubMed] [Google Scholar]
- 4.Constable R. Functional MR imaging using gradient-echo echo-planar imaging in the presence of large static field inhomogeneities. J Magn Reson Imag. 1995;5(6):746–752. doi: 10.1002/jmri.1880050622. [DOI] [PubMed] [Google Scholar]
- 5.Yang Q, Dardzinski B, Li S, Eslinger P, Smith M. Removal of local field gradient artifacts in T2*-weighted images at high fields by gradient-echo slice excitation profile imaging. Magn Reson Med. 1998;39:402–409. doi: 10.1002/mrm.1910390310. [DOI] [PubMed] [Google Scholar]
- 6.Merboldt K- D, Finsterbusch J, Frahm J. Reducing inhomogeneity artifacts in functional MRI of human brain activation-thin slices vs gradient compensation. J Magn Reson. 2000;145:184–191. doi: 10.1006/jmre.2000.2105. [DOI] [PubMed] [Google Scholar]
- 7.Cho Z, Ro Y. Reduction of susceptibility artifact in gradient-echo imaging. Magn Reson Med. 1992;23:193–200. doi: 10.1002/mrm.1910230120. [DOI] [PubMed] [Google Scholar]
- 8.Glover G, Lai S. Reduction of susceptibility effects in BOLD fMRI using tailored RF pulses.. Proc 6th Annual Meeting ISMRM; Sydney. 1998.p. 298. [Google Scholar]
- 9.Stenger VA, Boada FE, Noll DC. Three-dimensional tailored RF pulses for the reduction of susceptibility artifacts in T2*-weighted functional MRI. Magn Reson Med. 2000;44:525–531. doi: 10.1002/1522-2594(200010)44:4<525::aid-mrm5>3.0.co;2-l. [DOI] [PMC free article] [PubMed] [Google Scholar]
- 10.Stenger VA, Boada FE, Noll DC. Multishot 3D slice-select tailored RF pulses for MRI. Magn Reson Med. 2002;48:157–165. doi: 10.1002/mrm.10194. [DOI] [PMC free article] [PubMed] [Google Scholar]
- 11.Spielman DM, Pauly JM, Meyer CH. Magnetic resonance fluoroscopy using spirals with variable sampling densities. Magn Reson Med. 1995;34:388–394. doi: 10.1002/mrm.1910340316. [DOI] [PubMed] [Google Scholar]
- 12.Pauly JM, Nishimura D, Macovski A. A k-space analysis of small-tip-angle excitation. J Magn Reson. 1989;81:43–56. doi: 10.1016/j.jmr.2011.09.023. [DOI] [PubMed] [Google Scholar]
- 13.Hardy CCJ, Cline HE, Bottomley PA. Correcting for nonuniform k-space sampling in two-dimensional NMR selective excitation. J Magn Reson. 1990;87:639–645. [Google Scholar]
- 14.Pipe JG. Reconstructing MR images from undersampled data: data-weighting considerations. Magn Reson Med. 2000;43:867–875. doi: 10.1002/1522-2594(200006)43:6<867::aid-mrm13>3.0.co;2-2. [DOI] [PubMed] [Google Scholar]
- 15.Lee JH, Nishimura DG. Variable density k-space sampling.. Workshop on Minimum Data Acquisition Methods: Making More with Less; Marco Island, Florida, USA. 2001 20-21 October.pp. 11–14. [Google Scholar]
- 16.Madore B, Glover GH, Pelc NJ. Unaliasing by fourier encoding the overlaps using the temporal dimension (UNFOLD), applied to cardiac imaging and fMRI. Magn Reson Med. 1999;42:813–828. doi: 10.1002/(sici)1522-2594(199911)42:5<813::aid-mrm1>3.0.co;2-s. [DOI] [PubMed] [Google Scholar]
- 17.Katscher U, Bornert P, Leussler C, van den Brink J. Theory end experimental verification of transmit SENSE.. Proc10th Annual Meeting ISMRM; Honolulu. 2002.p. 189. [Google Scholar]
- 18.Zhu Y. Acceleration of focused excitation with transmit coil array.. Proc10th Annual Meeting ISMRM; Honolulu. 2002.p. 190. [Google Scholar]
- 19.Bornert P, Aldefeld B, Eggers H. Reversed spiral MR imaging. Magn Reson Med. 2000;44:479–484. doi: 10.1002/1522-2594(200009)44:3<479::aid-mrm20>3.0.co;2-2. [DOI] [PubMed] [Google Scholar]
- 20.Noll DC, Stenger VA. A 3D tailored RF pulse asymmetric spin-echo pulse sequence for susceptibility correction in functional MRI.. Proc10th Annual Meeting ISMRM; Honolulu. 2002.p. 206. [Google Scholar]


