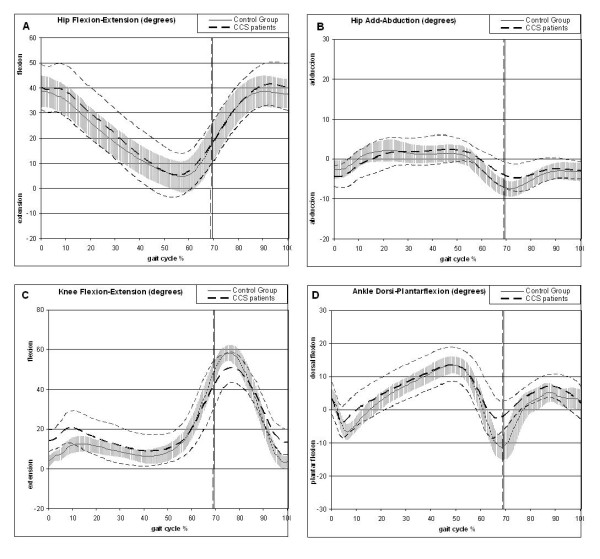
Figure 3.
Mean kinematic features of CCS patients (dashed line, mean and standard deviation) compared with the control group (continue thick line and grey line with standard deviation). The X-axis reflects the percentage of the gait cycle and on the Y-axis the units are in degrees. Kinematic curve for hip flexion-extension (A), hip adduction-abduction (B), knee flexion-extension (C) and the ankle dorsi-plantar flexion (D).

