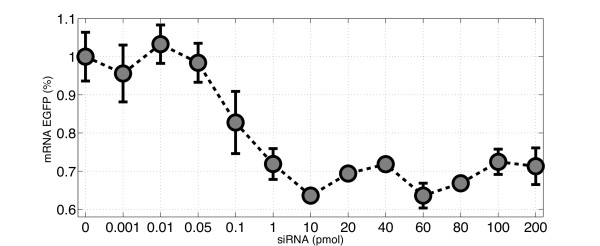
Figure 2.
Ratio of EGFP mRNA levels between cells transfected with the siRNAs specific for EGFP, and negative control cells, transfected with a non-specific siRNAs, measured 48 hours after transfection. Errorbars represent the standard-error from three biological replicates for each point. The x-axis reports the different quantities of siRNA oligomers tested. mRNA levels were measured using real-time PCR. The error-bars have the length of one standard error.

