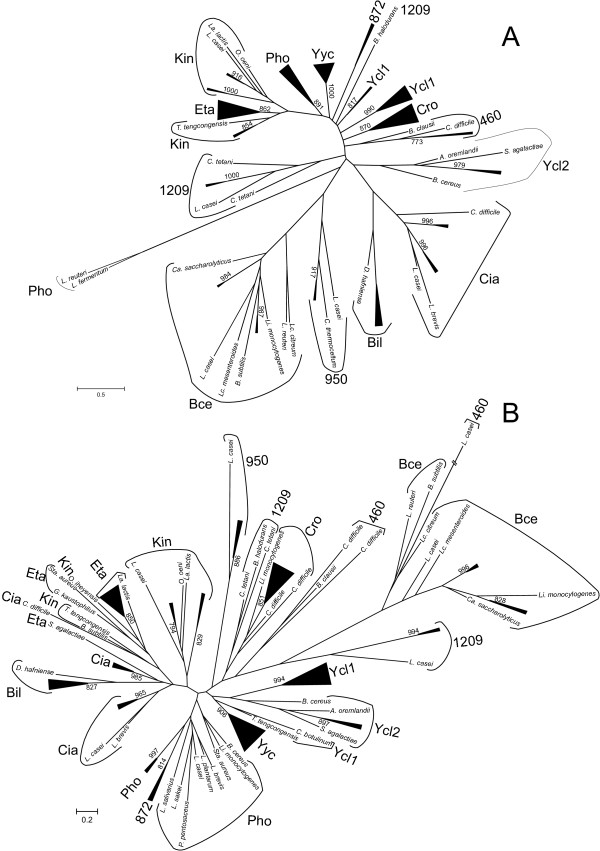
Figure 2.
Summarized maximum likelihood topology of the OmpR and IIIA sequences used in this study. A. Topology of OmpR (RR) sequences. B. Topology of IIIA (HK) sequences used in this study. The complete trees are shown in Fig. S2 in additional file 3. Support values for the bootstrap analysis by maximum likelihood with support values higher than 750 (1000 bootstrap replicates). The clusters of orthologs derived from the analysis are indicated. The length of the Lactobacillus casei 460 HK branch has been shortened. Additional details are provided in additional file 1 and Fig. S2 in additional file 2.

