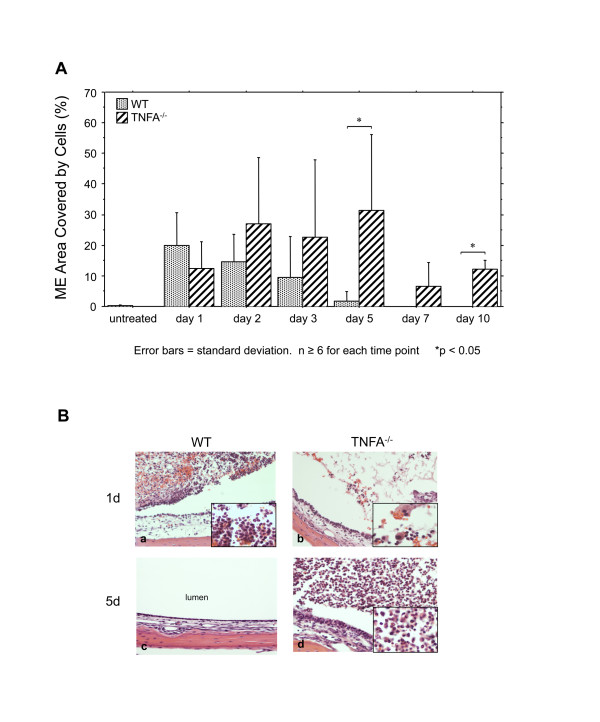
Figure 5.
Leukocyte infiltration of the ME during OM. A. Percentage of the ME lumen occupied by inflammatory cells after challenge with NTHi in WT (stippled bars) and TNFA-/- (striped bars). Bars represent means, while lines represent 1 SD. * = p ≤ 0.05; n = 6-10 for each group. B. Micrographs representing the typical appearance of cellular infiltrates in the two genotypes at 1 and 5 days after NTHi inoculation. Magnification 150× (insert = 400×)

