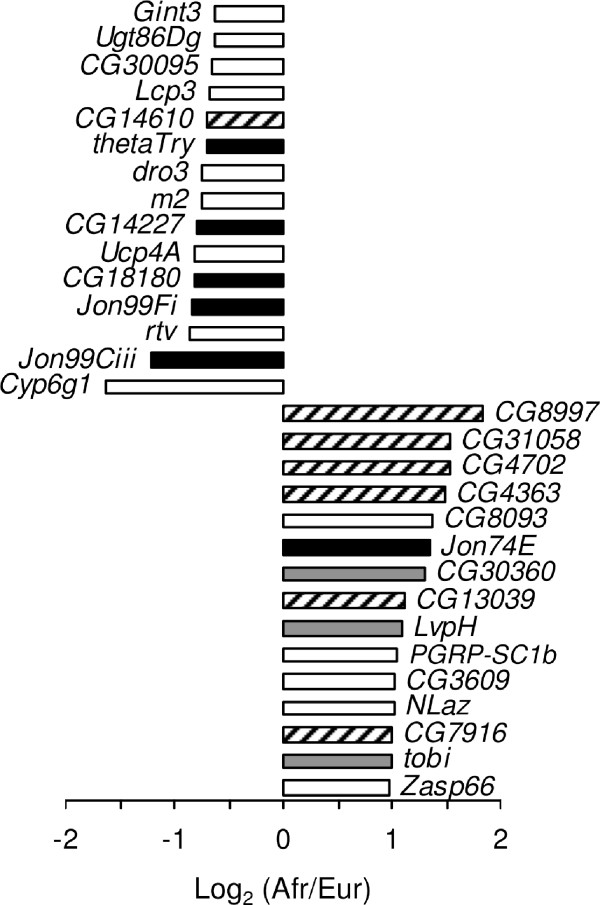
Figure 3.
The top 15 over-expressed genes in each population. The horizontal bars indicate the ratio of African-to-European expression for each gene. Black bars represent genes that function in proteolysis, while gray bars indicate genes that function in carbohydrate metabolism. Genes of unknown function are indicated by hatched bars.

