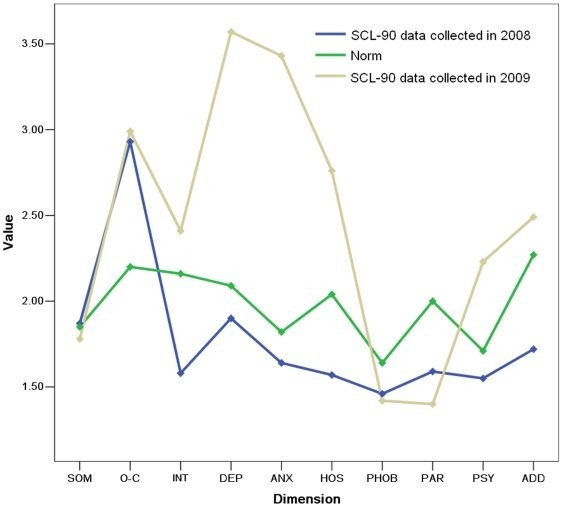
Figure 1. Mean scores of SCL-90 dimensions in different groups.
The figure shows the characteristics of different dimensions in different measures. From this figure, we can see that INT, DEP, ANX, HOS and PSY changed fiercely between data collected in 2008 and 2009. However, SOM, O-C, and PHOB showed little changes.

