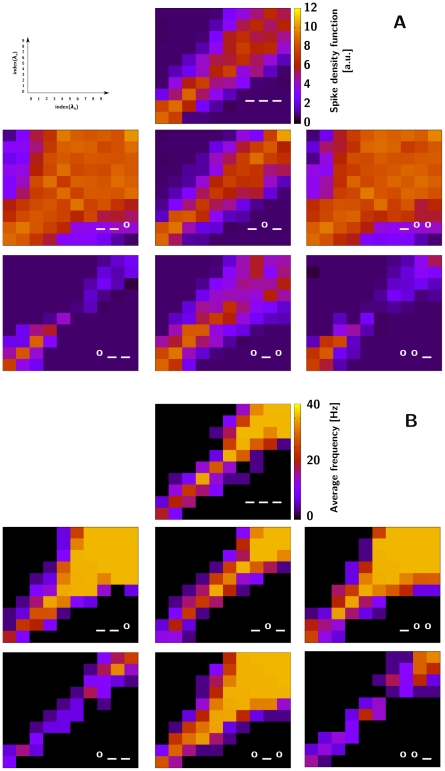
Figure 4. The balance of inter-LN connection strengths affects the ratio recognition accuracy.
A) Response profiles in the conductance-based setup. B) Response profiles in the rate-based setup. The three symbols in each panel indicate, in order, the synaptic strengths on LNsp-LNgen, LNsp-LNsp and LNgen-LNsp connections, where “_” is the value for that connection found in the annealing optimisation (Table 1), and “o” is that value times 1.3 (A) or 1.5 (B). The x- and y-axes represent the concentration of individual components in the blend as the log of the Poisson firing rate of ORNs; the colour code of the squares shows the SDF (spike-density function) (A) and the average spiking rate (B), see respective colour bars. ORN-LN convergence rate used was 1000.

