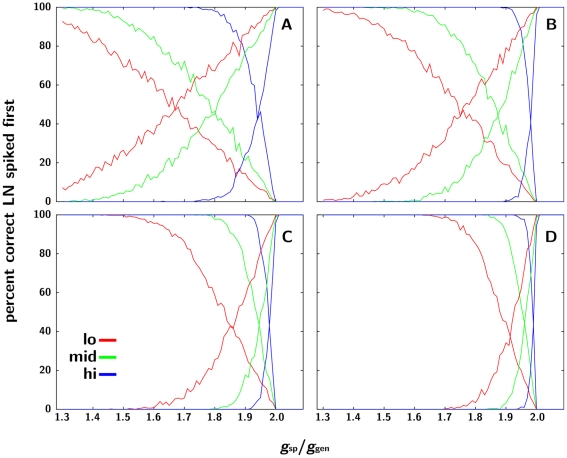
Figure 5. Percentage of LNc responses as a function of the ratio g ORN-LNsp/g ORN-LNgen.
A–D, ORN∶LN convergence rates of 100, 200, 500 and 1000. The descending lines in each panel represent the percentage of responses to the 1∶1 ratio where LNc spikes first (true positives for 1∶1); ascending lines, the percentage of responses where an LNsp (specifically, LNb) fired first (true positives for non-1∶1 ratios immediately adjacent to the target 1∶1 ratio). The colours correspond to low (red), medium (green) and high (blue) pheromone blend concentrations. Note that there is no value of g ORN-LNsp/g ORN-LNgen where both true positives are high simultaneously.

