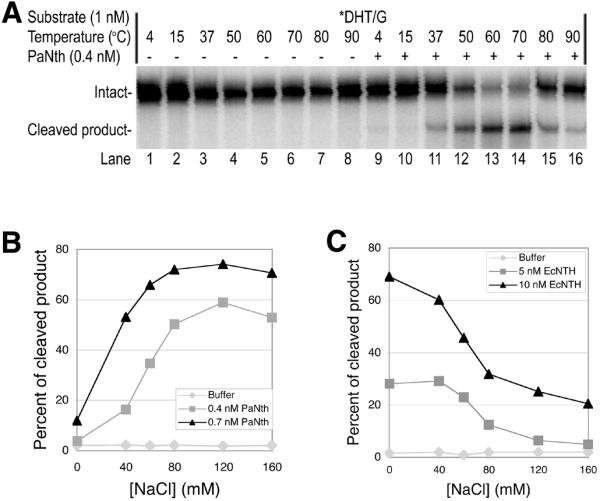
Figure 4.

Optimal temperature and NaCl concentrations for PaNth activity. The glycosylase reaction was carried out for 15 min with 1 nM *DHT/G, where the asterisk indicates the 5′-end-labeled strand. Each reaction was then analyzed on a 15% denaturing polyacrylamide gel. (A) Phosphoimage of the reactions in the presence (+) or absence (–) of 0.4 nM PaNth over increasing temperatures. The intact 96mer DNA (Intact) and cleaved 60mer product (Cleaved product) are indicated on the left. (B) Plot of the percentage cleaved versus NaCl concentration with 0.4 or 0.7 nM PaNth or buffer at 70°C. (C) Plot of the percentage cleaved versus NaCl concentration with 5 or 10 nM EcNth or buffer at 37°C.
