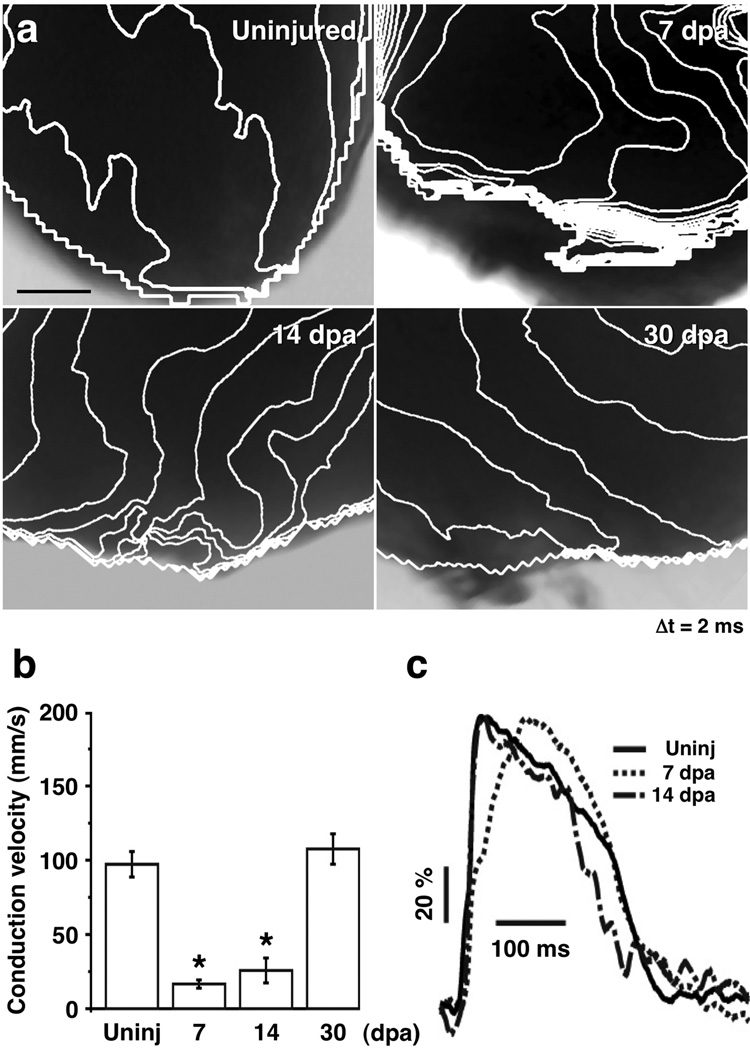
Figure 3. Electrical coupling of regenerated cardiomyocytes.
a, Two-millisecond isochronal density maps of surface myocardium near the apex of explants of uninjured, 7, 14, and 30 dpa ventricles. b, Mean conduction velocities measured from local velocity vectors, indicating slowed velocities at 7 and 14 dpa. Mean ± s.e.m, n = 4 to 7 ventricles for each timepoint. One-way ANOVA, *P < 0.05. c, Representative traces of surface action potentials, indicating a slowing of the maximum depolarization rate at 7 dpa. Scale bar, 100 µm.

