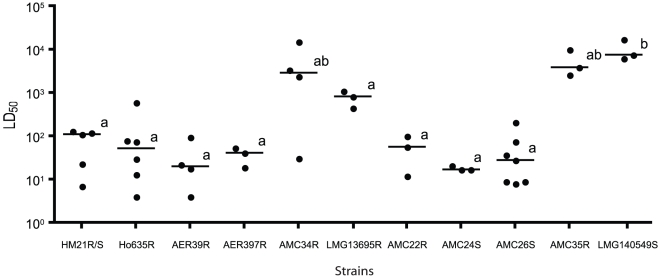
Figure 2. Virulence of AVG isolates in the Galleria mellonella infection model.
The LD50 was calculated for each isolate 24 h after G. mellonella larvae were inoculated using the Reed-Muench method [59]. Horizontal lines represent median LD50 values. Strains with common letters are not statistically different from one another as determined by one-way ANOVA with Tukey's post-hoc test, P<0.05.

