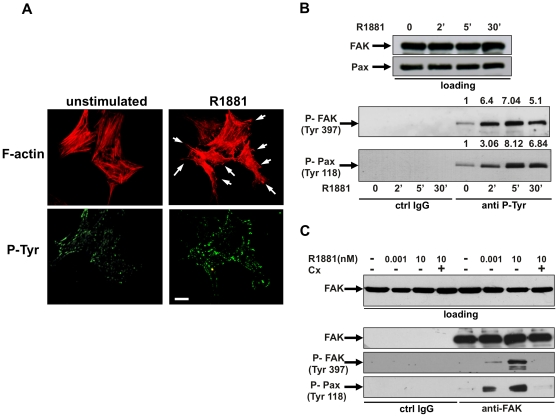
Figure 2. R1881-stimulated fibroblast migration: the role of FAK and paxillin.
In A, B and C, quiescent NIH3T3 cells were used. In A, cells on coverslips were left unstimulated or stimulated for 20 min with 10 nM R1881 and then analyzed by IF for F-actin (upper images) and P-Tyr (lower images). Images are representative of three independent experiments. Arrows indicate the protrusions and ruffles caused by androgen treatment of cells. Scale bar, 5 microm. In B and C, cells were untreated or treated for the indicated times (B) or for 5 min (C) with R1881 (at 1 pM or 10 nM). Casodex (Cx) was added at a 1000-fold excess. In B, cell lysates were immunoblotted using antibodies against FAK or paxillin (loading). Similar amounts of lysate proteins were immunoprecipitated with control IgG (from Pierce; ctrl IgG) or anti-P-Tyr (anti-P-Tyr) antibody. Immunoprecipitated proteins were analyzed using antibodies against the indicated proteins. For each phospho-blot, data were analyzed using the NIH Image J program and expressed as relative increase. Numbers in the upper portion of corresponding blots represent the increase in P-FAK or P-paxillin. In C, cell lysates containing similar amounts of total FAK (loading) were incubated with control IgG (ctrl IgG) or anti-FAK antibody and proteins in immunocomplexes were blotted using antibodies against the indicated proteins.

